Energy
Charted: 40 Years of Global Energy Production, by Country
Article/Editing:
Energy was already a hot topic before 2022, but soaring household energy bills and a cost of living crisis has brought it even more to the forefront.
Which countries are the biggest energy producers, and what types of energy are they churning out? This graphic by 911 Metallurgist gives a breakdown of global energy production, showing which countries have used the most fossil fuels, nuclear, and renewable energy since 1980.
All figures refer to the British thermal unit (BTU), equivalent to the heat required to heat one pound of water by one degree Fahrenheit.
Editor’s note: Click on any graphic to see a full-width version that is higher resolution
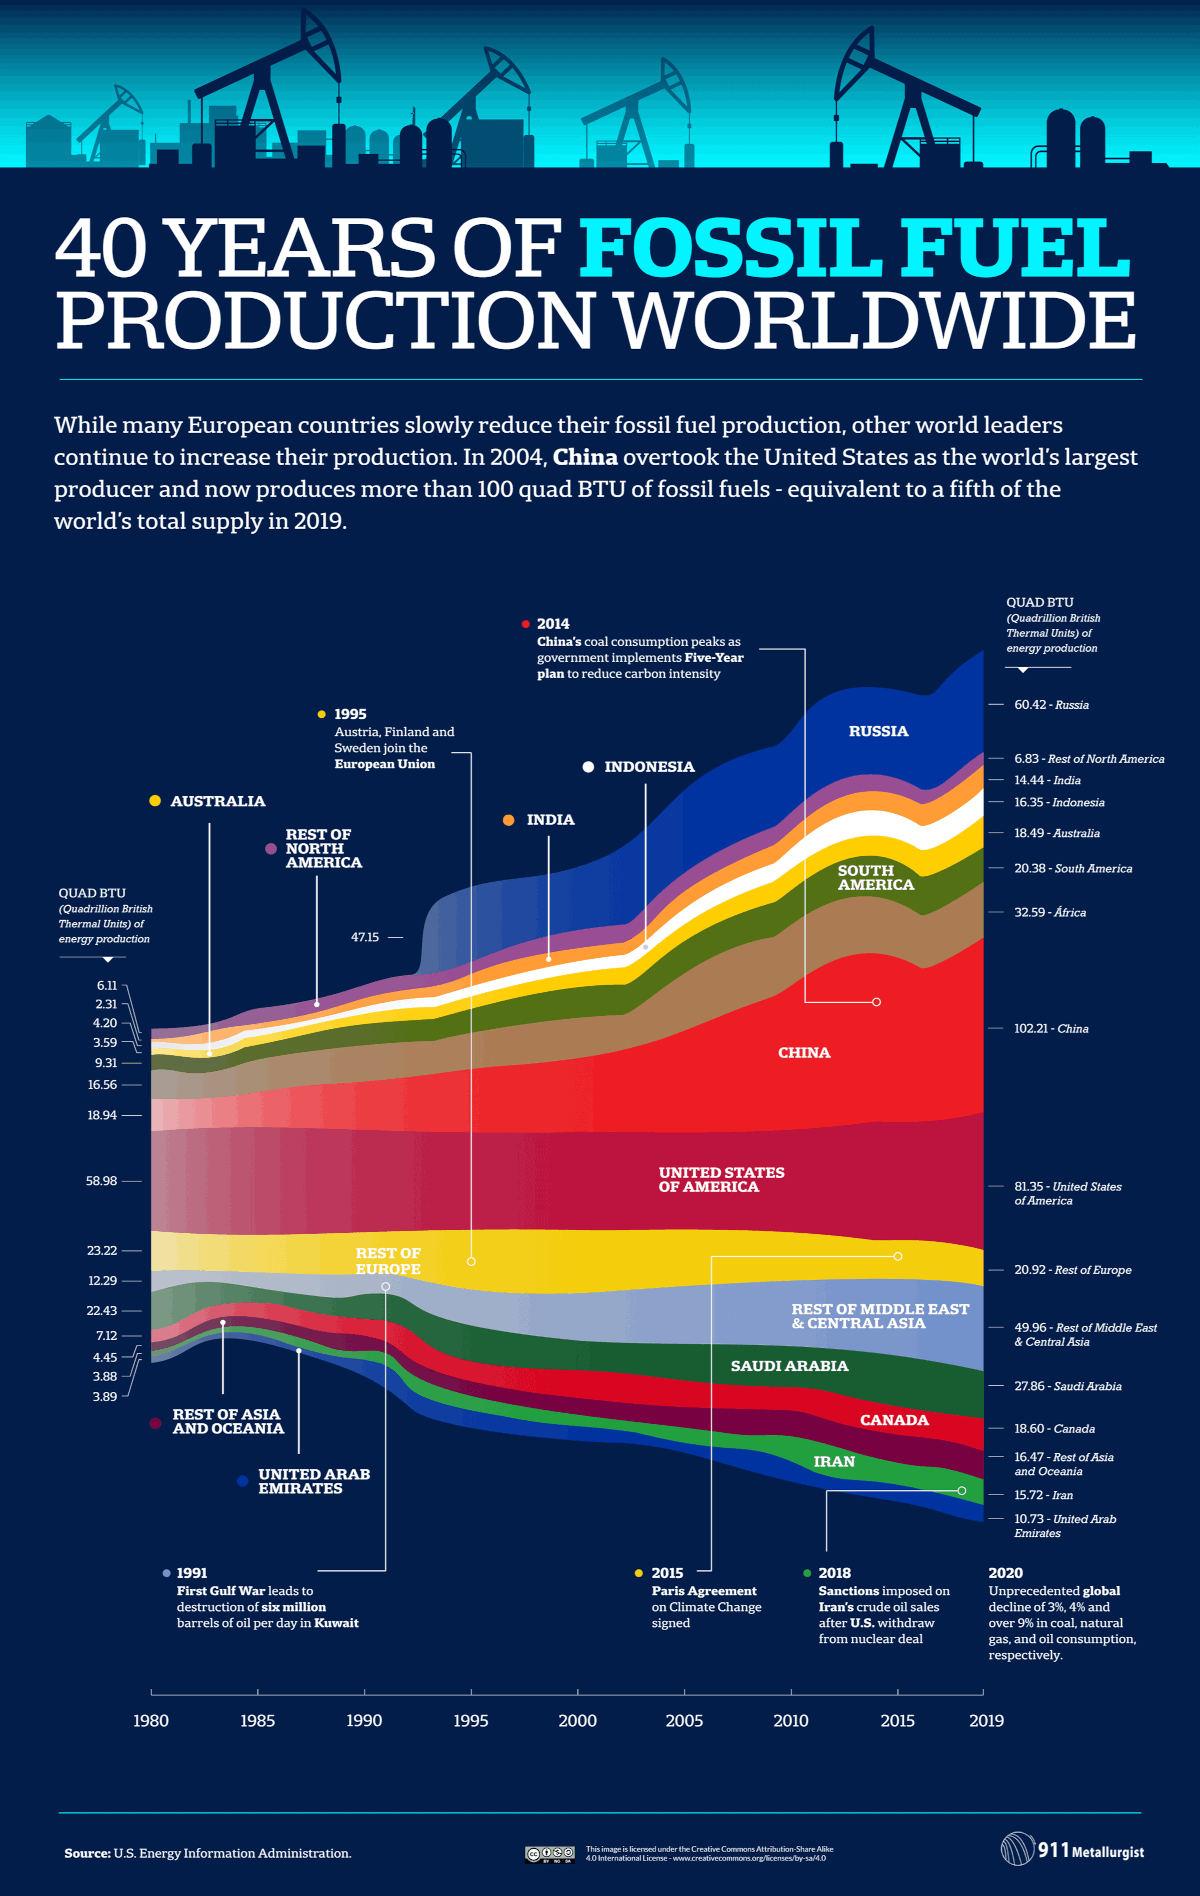
1. Fossil Fuels
View the full-size infographic
While the U.S. is a dominant player in both oil and natural gas production, China holds the top spot as the world’s largest fossil fuel producer, largely because of its significant production and consumption of coal.
Over the last decade, China has used more coal than the rest of the world, combined.
However, it’s worth noting that the country’s fossil fuel consumption and production have dipped in recent years, ever since the government launched a five-year plan back in 2014 to help reduce carbon emissions.
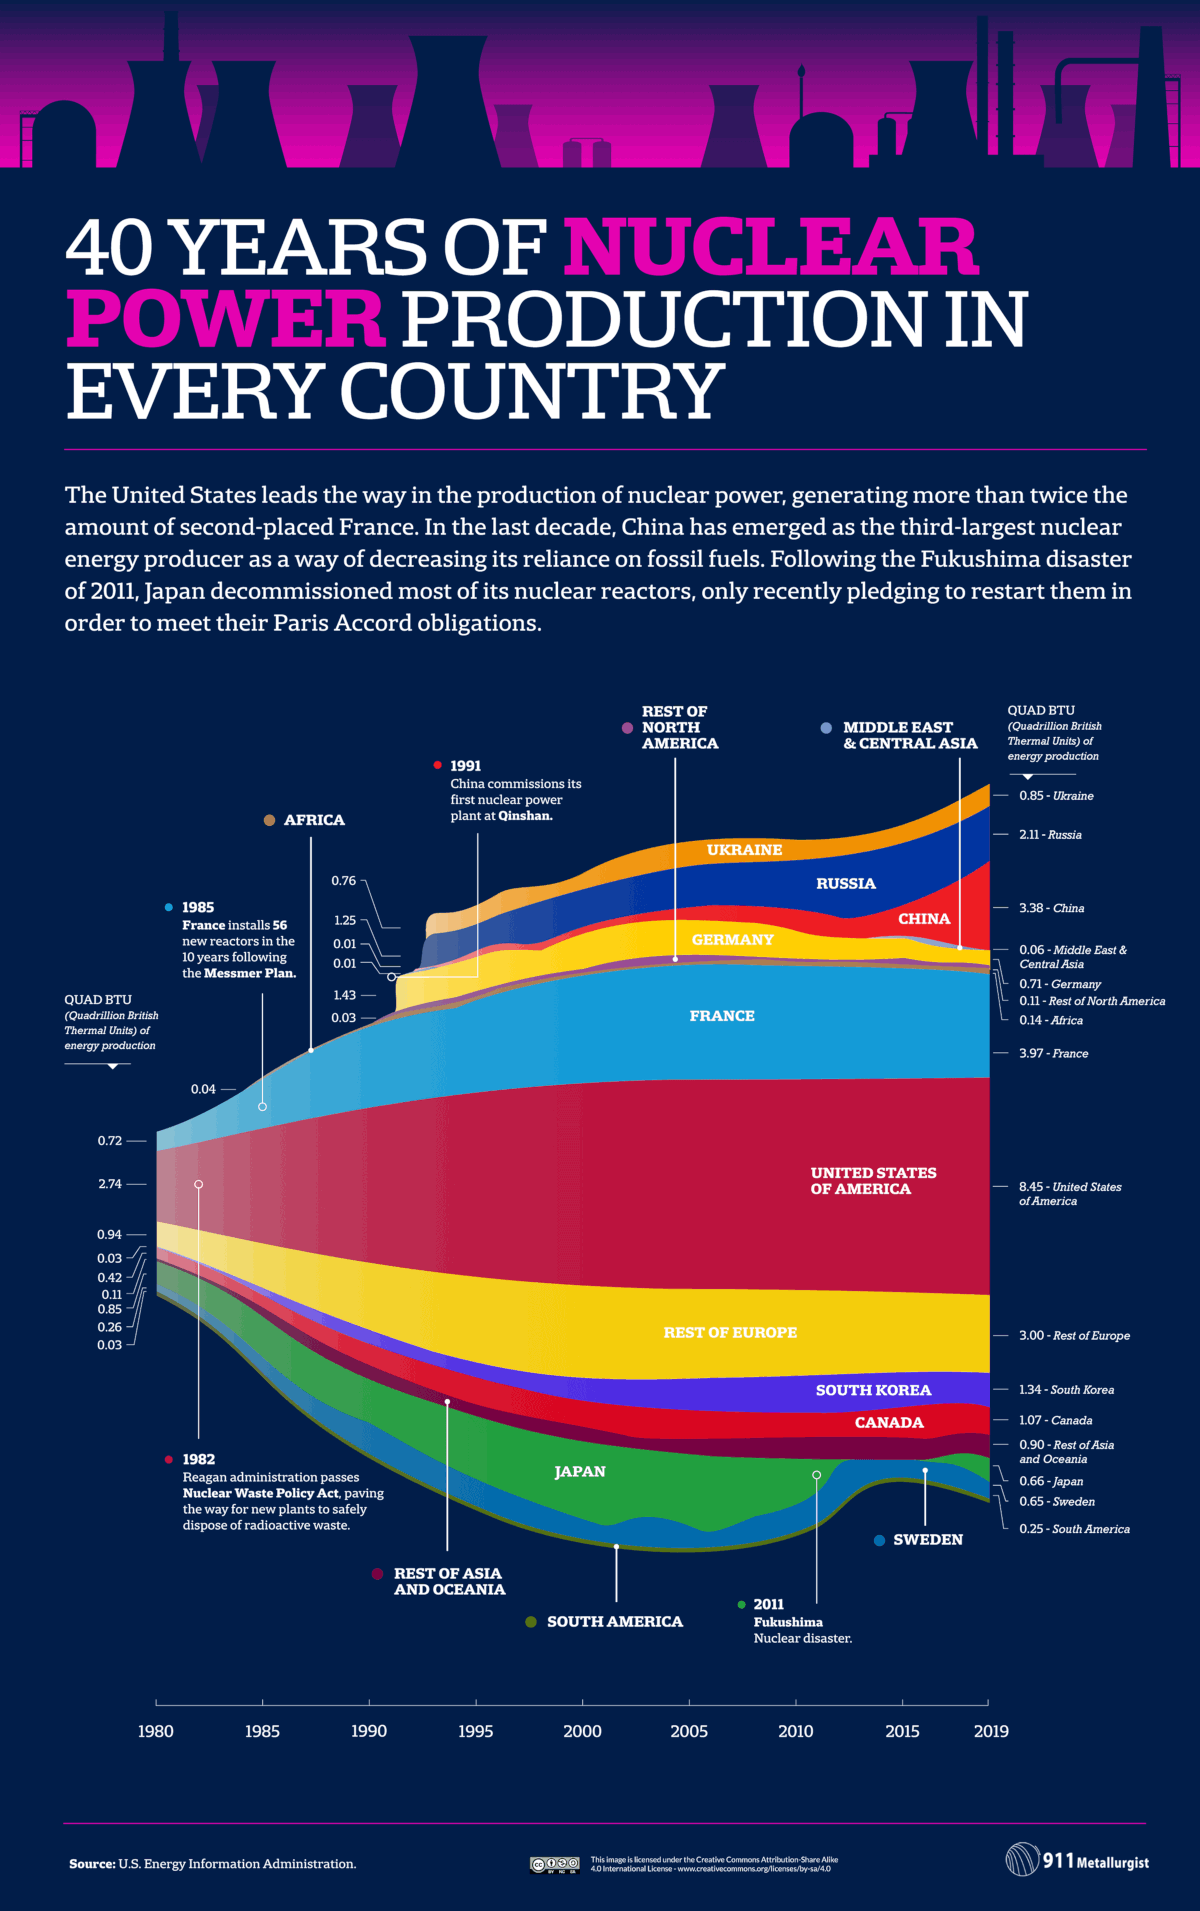
2. Nuclear Power
View the full-size infographic
The U.S. is the world’s largest producer of nuclear power by far, generating about double the amount of nuclear energy as France, the second-largest producer.
While nuclear power provides a carbon-free alternative to fossil fuels, the nuclear disaster in Fukushima caused many countries to move away from the energy source, which is why global use has dipped in recent years.
Despite the fact that many countries have recently pivoted away from nuclear energy, it still powers about 10% of the world’s electricity. It’s also possible that nuclear energy will play an expanded role in the energy mix going forward, since decarbonization has emerged as a top priority for nations around the world.
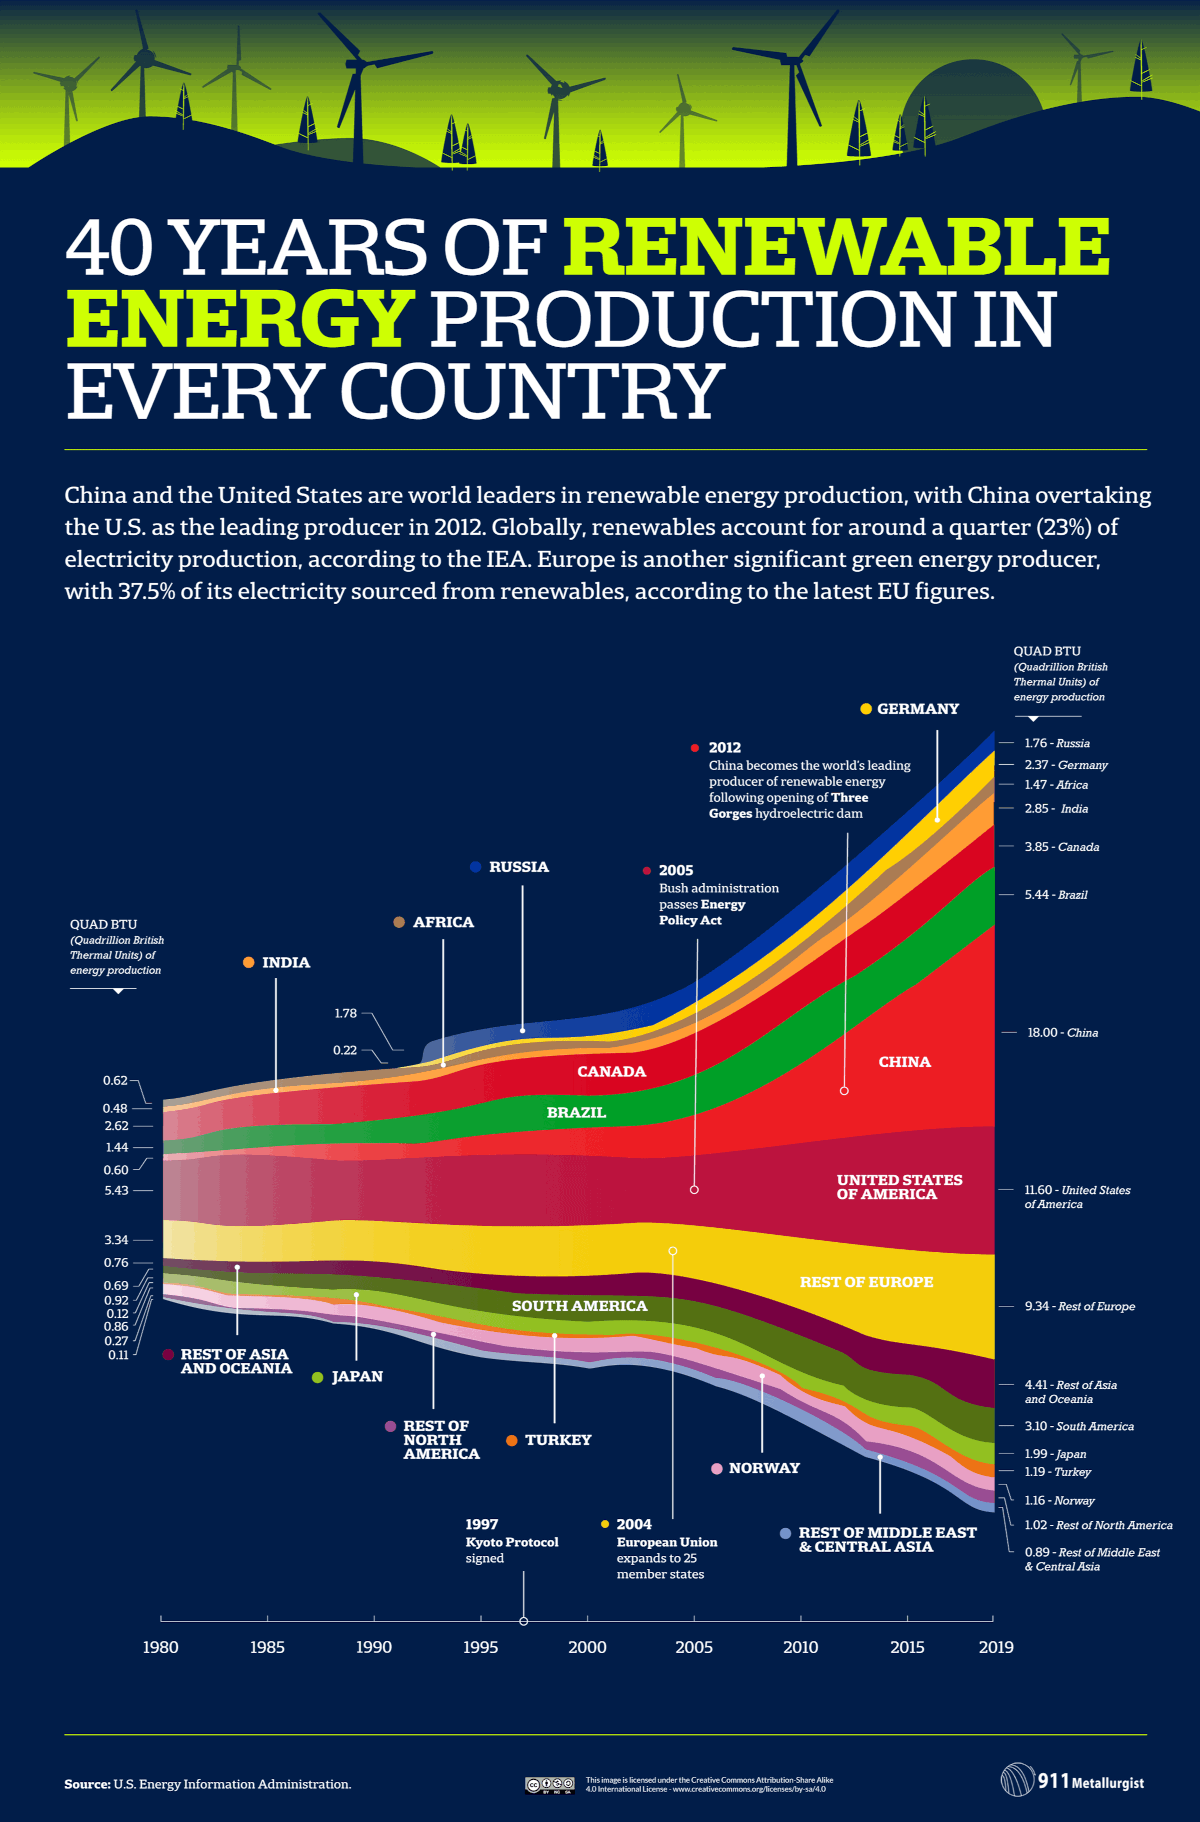
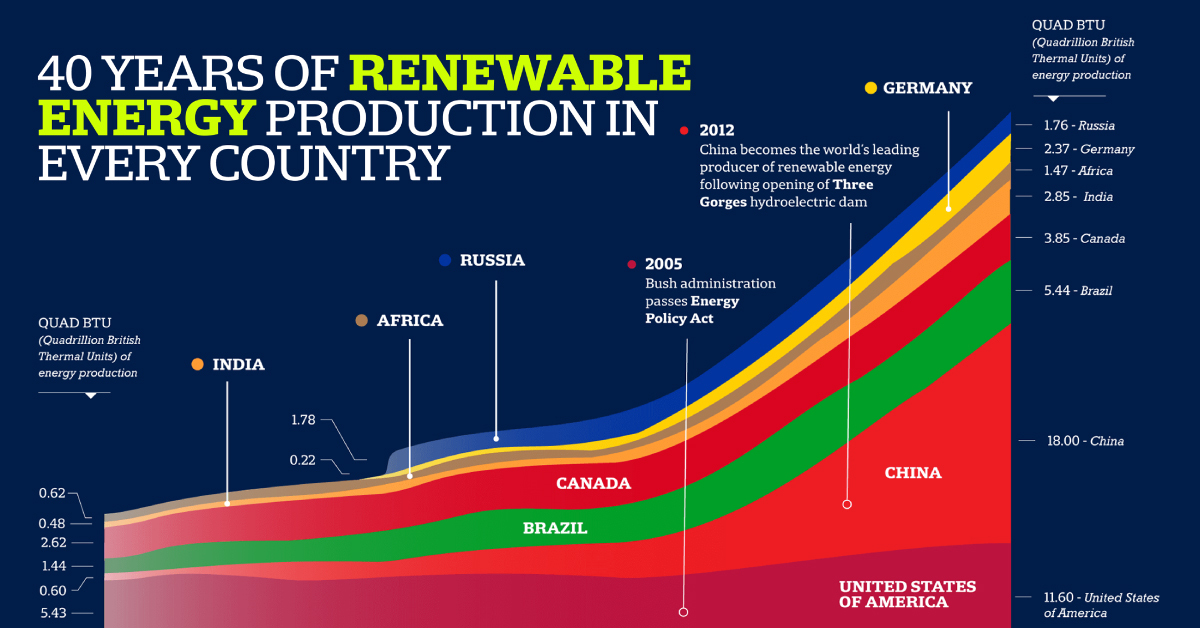
3. Renewable Energy
View the full-size infographic
Renewable energy sources (including wind, hydro, and solar) account for about 23% of electricity production worldwide. China leads the front on renewable production, while the U.S. comes in second place.
While renewable energy production has ramped up in recent years, more countries will need to ramp up their renewable energy production in order to reach net-zero targets by 2050.

This article was published as a part of Visual Capitalist's Creator Program, which features data-driven visuals from some of our favorite Creators around the world.


Who’s Building the Most Solar Energy?
This was originally posted on our Voronoi app. Download the app for free on iOS or Android and discover incredible data-driven charts from a variety of trusted sources.
In 2023, solar energy accounted for three-quarters of renewable capacity additions worldwide. Most of this growth occurred in Asia, the EU, and the U.S., continuing a trend observed over the past decade.
In this graphic, we illustrate the rise in installed solar photovoltaic (PV) capacity in China, the EU, and the U.S. between 2010 and 2022, measured in gigawatts (GW). Bruegel compiled the data..
Chinese Dominance
As of 2022, China’s total installed capacity stands at 393 GW, nearly double that of the EU’s 205 GW and surpassing the USA’s total of 113 GW by more than threefold in absolute terms.
| Installed solar capacity (GW) | China | EU27 | U.S. |
|---|---|---|---|
| 2022 | 393.0 | 205.5 | 113.0 |
| 2021 | 307.0 | 162.7 | 95.4 |
| 2020 | 254.0 | 136.9 | 76.4 |
| 2019 | 205.0 | 120.1 | 61.6 |
| 2018 | 175.3 | 104.0 | 52.0 |
| 2017 | 130.8 | 96.2 | 43.8 |
| 2016 | 77.8 | 91.5 | 35.4 |
| 2015 | 43.6 | 87.7 | 24.2 |
| 2014 | 28.4 | 83.6 | 18.1 |
| 2013 | 17.8 | 79.7 | 13.3 |
| 2012 | 6.7 | 71.1 | 8.6 |
| 2011 | 3.1 | 53.3 | 5.6 |
| 2010 | 1.0 | 30.6 | 3.4 |
Since 2017, China has shown a compound annual growth rate (CAGR) of approximately 25% in installed PV capacity, while the USA has seen a CAGR of 21%, and the EU of 16%.
Additionally, China dominates the production of solar power components, currently controlling around 80% of the world’s solar panel supply chain.
In 2022, China’s solar industry employed 2.76 million individuals, with manufacturing roles representing approximately 1.8 million and the remaining 918,000 jobs in construction, installation, and operations and maintenance.
The EU industry employed 648,000 individuals, while the U.S. reached 264,000 jobs.
According to the IEA, China accounts for almost 60% of new renewable capacity expected to become operational globally by 2028.
Despite the phasing out of national subsidies in 2020 and 2021, deployment of solar PV in China is accelerating. The country is expected to reach its national 2030 target for wind and solar PV installations in 2024, six years ahead of schedule.

-

 Markets6 days ago
The Best U.S. Companies to Work for According to LinkedIn
-

 VC+2 weeks ago
VC+: Get Our Key Takeaways From the IMF’s World Economic Outlook
-

 Demographics2 weeks ago
The Countries That Have Become Sadder Since 2010
-

 Money2 weeks ago
Charted: Who Has Savings in This Economy?
-

 Technology2 weeks ago
Visualizing AI Patents by Country
-

 Economy2 weeks ago
Economic Growth Forecasts for G7 and BRICS Countries in 2024
-

 Wealth1 week ago
Charted: Which City Has the Most Billionaires in 2024?
-

 Technology1 week ago
All of the Grants Given by the U.S. CHIPS Act