Jobs
Mapped: Average Internship Salary By U.S. State in 2022
Article/Editing:
Click to view this graphic in a higher-resolution.
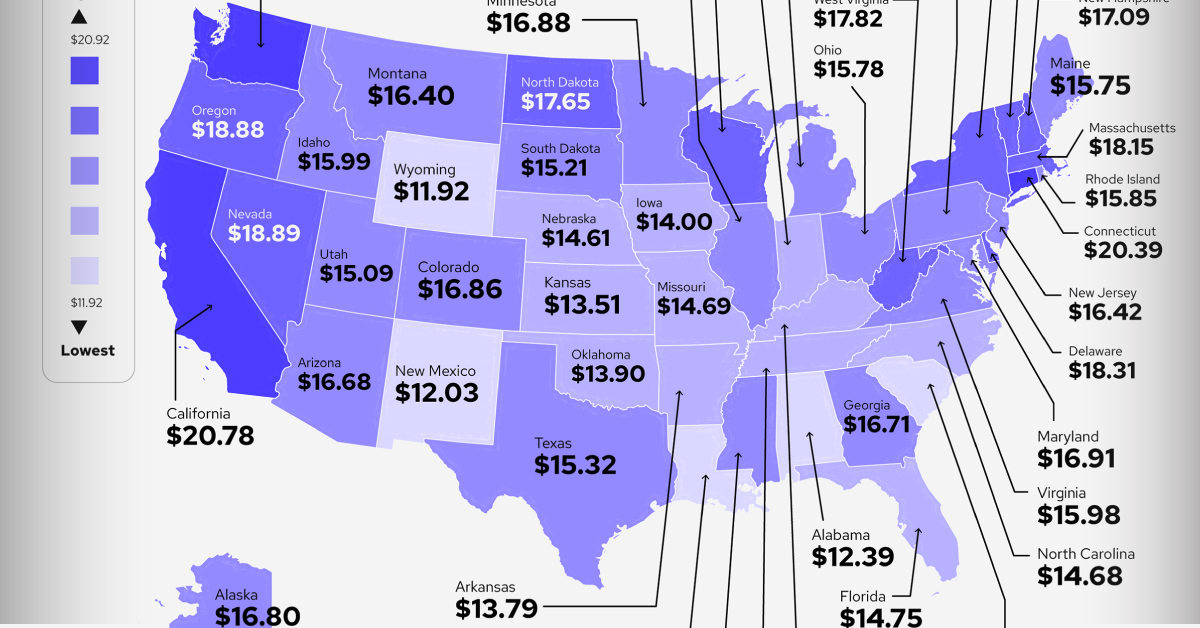
Mapping The Best Places to Intern in the U.S.
Modern day internships vary wildly by industry, covering anything from coffee runs to working on high-profile projects, and from 90-hour weeks to part-time jobs.
The internship salaries offered also vary wildly by both location and industry. Some are full-time paid positions, others are unpaid, “for the experience” gigs.
Bringing some transparency into the ever-changing internship world, CashNetUSA sourced data in 2022 from listings on Chegg Internships and Zippia, creating a database of internship salary rates by hourly pay across state and sector.
The Highest Average Internship Salary by State
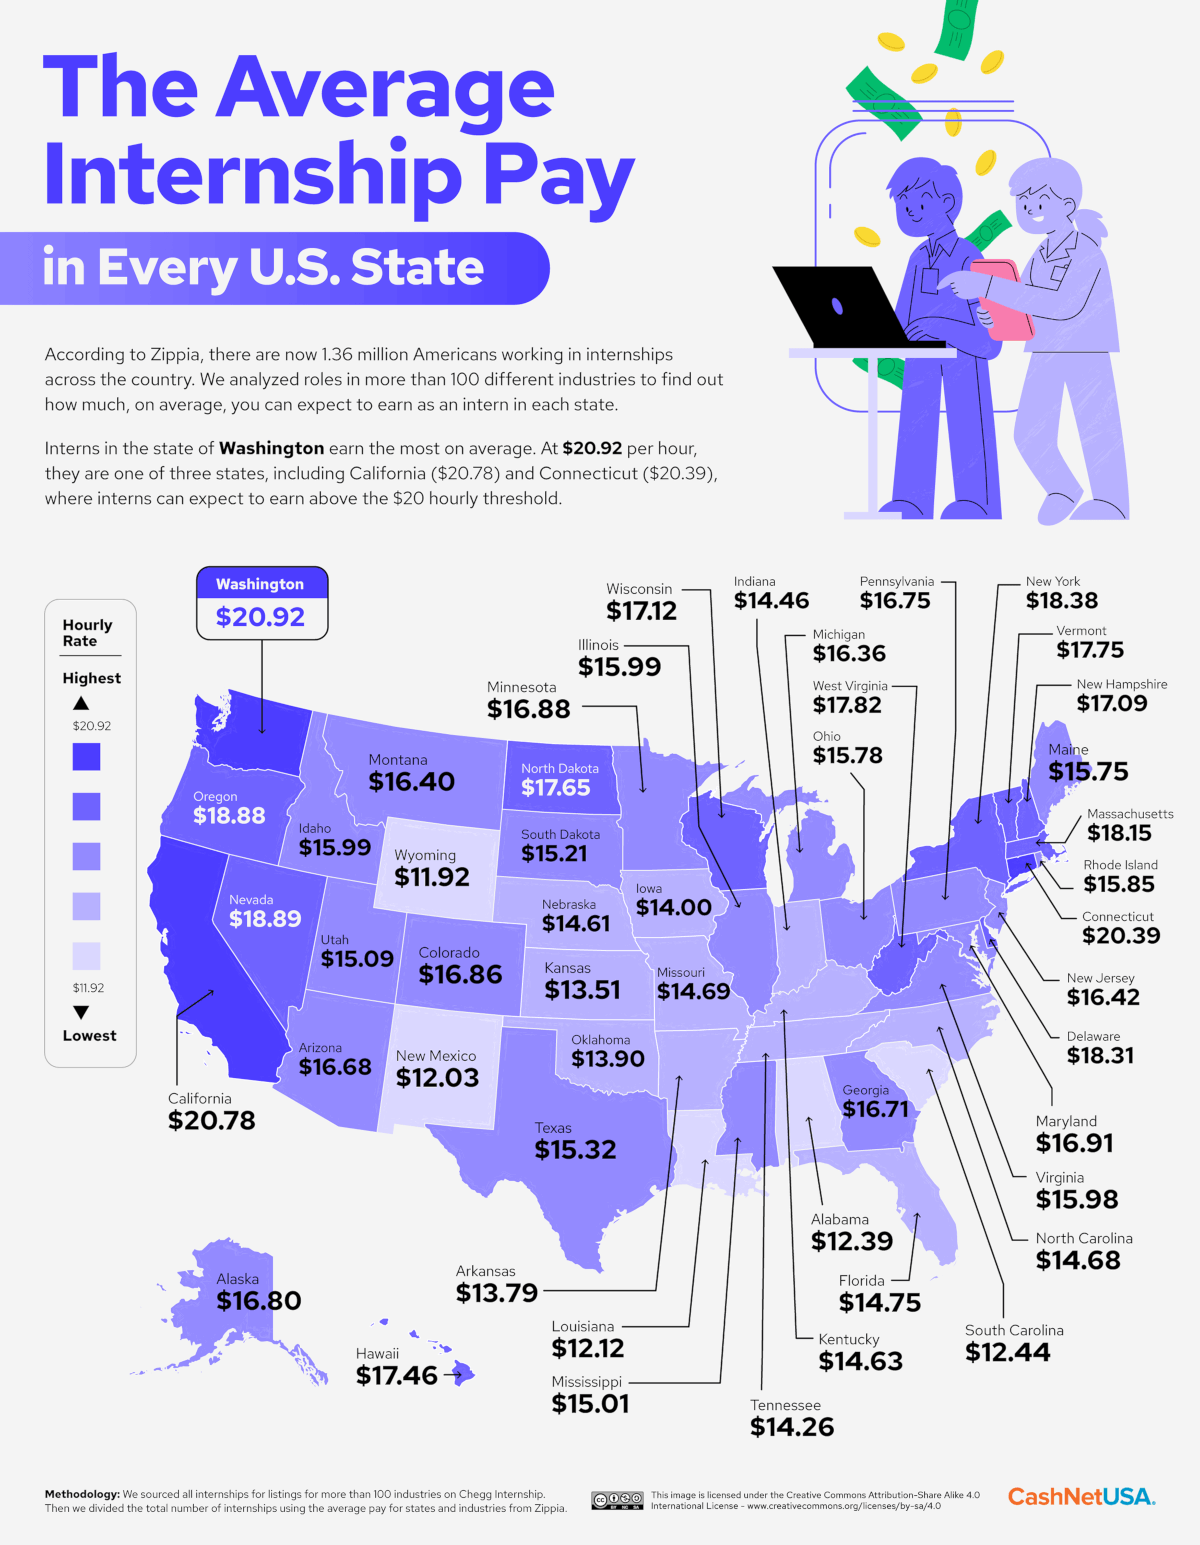
Across the 50 states in the U.S., three stand out above the competition when it comes to the average internship salaries.
Interns in Washington, California, and Connecticut were offered more than $20 an hour, nearly $5 more than minimum wage in each of these states.
| State | Hourly Rate |
|---|---|
| Washington | $20.92 |
| California | $20.78 |
| Connecticut | $20.39 |
| Nevada | $18.89 |
| Oregon | $18.88 |
| New York | $18.38 |
| Delaware | $18.31 |
| Massachusetts | $18.15 |
| West Virginia | $17.82 |
| Vermont | $17.75 |
| North Dakota | $17.65 |
| Hawaii | $17.46 |
| Wisconsin | $17.12 |
| New Hampshire | $17.09 |
| Maryland | $16.91 |
| Minnesota | $16.88 |
| Colorado | $16.86 |
| Alaska | $16.80 |
| Pennsylvania | $16.75 |
| Georgia | $16.71 |
| Arizona | $16.68 |
| New Jersey | $16.42 |
| Montana | $16.40 |
| Michigan | $16.36 |
| Idaho | $15.99 |
| Illinois | $15.99 |
| Virginia | $15.98 |
| Rhode Island | $15.85 |
| Ohio | $15.78 |
| Maine | $15.75 |
| Texas | $15.32 |
| South Dakota | $15.21 |
| Utah | $15.09 |
| Mississippi | $15.01 |
| Florida | $14.75 |
| Missouri | $14.69 |
| North Carolina | $14.68 |
| Kentucky | $14.63 |
| Nebraska | $14.61 |
| Indiana | $14.46 |
| Tennessee | $14.26 |
| Iowa | $14.00 |
| Oklahoma | $13.90 |
| Arkansas | $13.79 |
| Kansas | $13.51 |
| South Carolina | $12.44 |
| Alabama | $12.39 |
| Louisiana | $12.12 |
| New Mexico | $12.03 |
| Wyoming | $11.92 |
On the lower side, internships in Wyoming, New Mexico, and Louisiana pay around $12/hour.
Part of the discrepancy in these figures is the cost of living for each state, with the more expensive coastal states paying more than their interior peers.
Six of the states with the highest average internship salary rates (California, New York, Connecticut, Vermont, Oregon, and Massachusetts) are the most expensive states to live in. The reverse is also true, with some of the lowest-paying states matching a lower cost of living.
When adjusting for cost of living, the internship pays in Washington and West Virginia come out better than average.
Sectors With the Best Paid Internships
Looking at the states with the best internship pay also helps highlight the specific sectors which pay their interns well.
Unsurprisingly, tech internships mainly in California and Washington pay the best ($19.77), followed by the finance sector mainly in New York ($18.10).
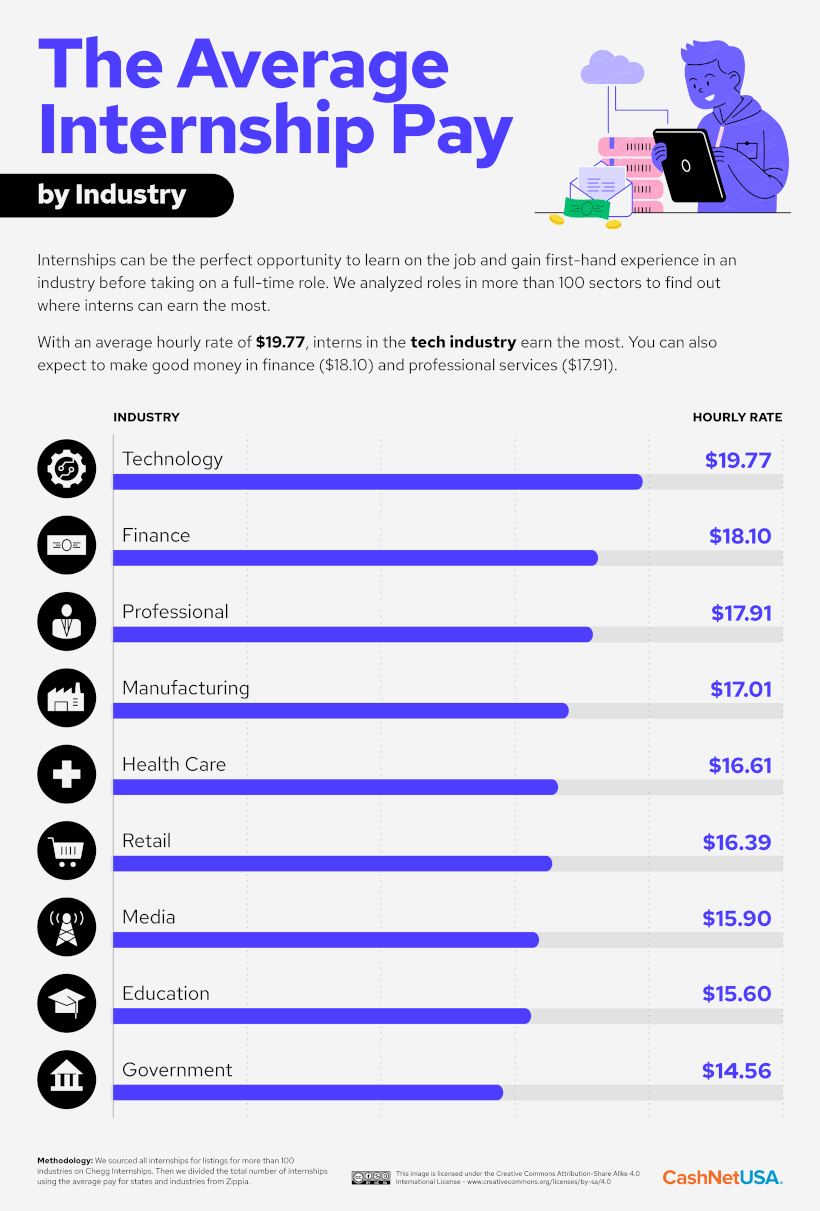
Both industries are, of course, well-known for high pay packages for their employees. They’re on the opposite side of the spectrum from government internships, which rank last despite coveted D.C. positions paying fairly well.
States with the Most Unpaid Internships
Getting an internship doesn’t guarantee pay, and average hourly pay means little in states which have mostly unpaid interns.
In Delaware for example, nearly one-third of internships are unpaid despite otherwise boasting a high average pay.
Click to view this graphic in a higher-resolution.
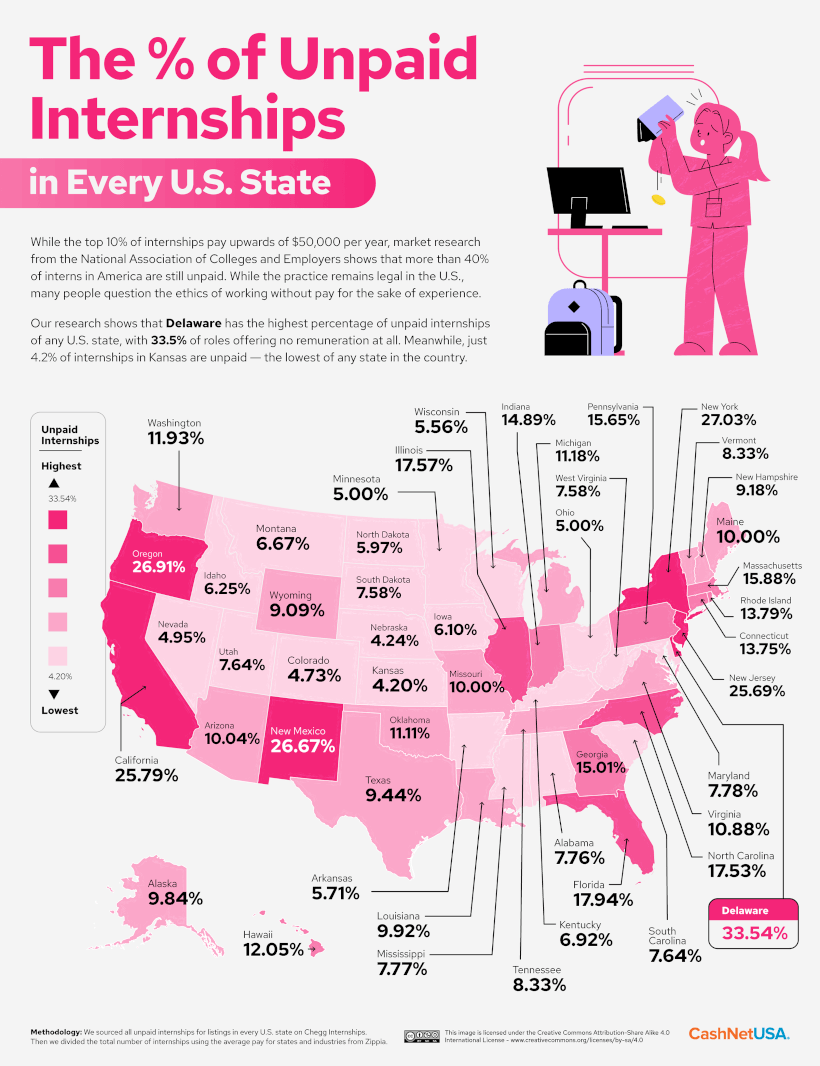
New York, Oregon, New Mexico, California, and New Jersey all had nearly one-fourth of their listed internships as unpaid.
Meanwhile, the outer Midwest states, including Nebraska and Colorado, have some of the lowest unpaid internship rates of anywhere in the country. In Kansas, despite having some of the lowest internship pay, only 4.2% of internships were unpaid.
Sectors with the Most Unpaid Internships
The finance sector—also the second highest paying—is notorious for rigorous internships, but nearly one-third of listed finance internships were posted with no pay, and only experience.
That’s nearly twice the rate of the second-most unpaid internship sector: retail.
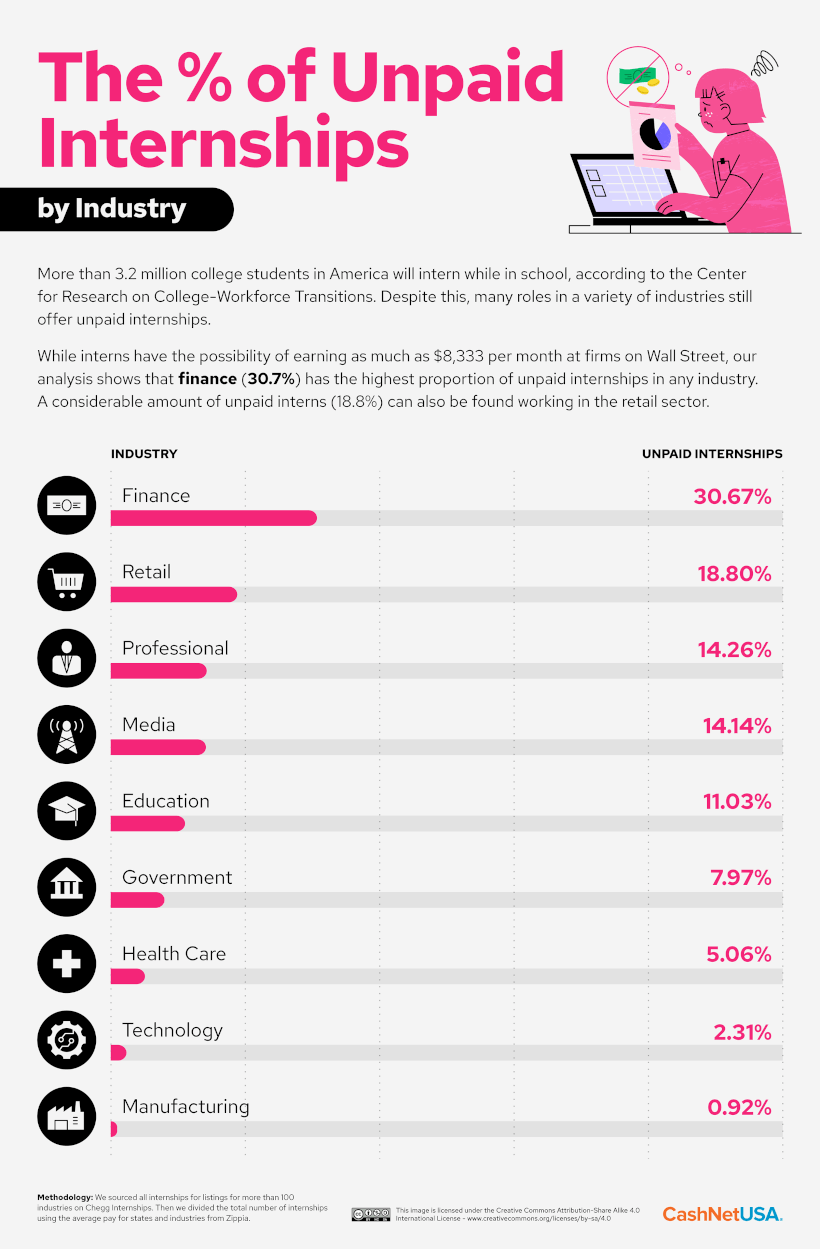
Interestingly, the tech sector had the second-fewest unpaid internships, despite paying the highest hourly rate. Only manufacturing has fewer unpaid internships.
A majority of students surveyed from the National Association of Colleges and Employers (NACE) found that those who took unpaid internships had a slightly higher positive correlation in networking than a paid internship. However, they also had a negative correlation with both employment and salary satisfaction.

This article was published as a part of Visual Capitalist's Creator Program, which features data-driven visuals from some of our favorite Creators around the world.


Jobs
The Best U.S. Companies to Work for According to LinkedIn
We visualized the results of a LinkedIn study on the best U.S. companies to work for in 2024.
The Best U.S. Companies to Work for According to LinkedIn
This was originally posted on our Voronoi app. Download the app for free on iOS or Android and discover incredible data-driven charts from a variety of trusted sources.
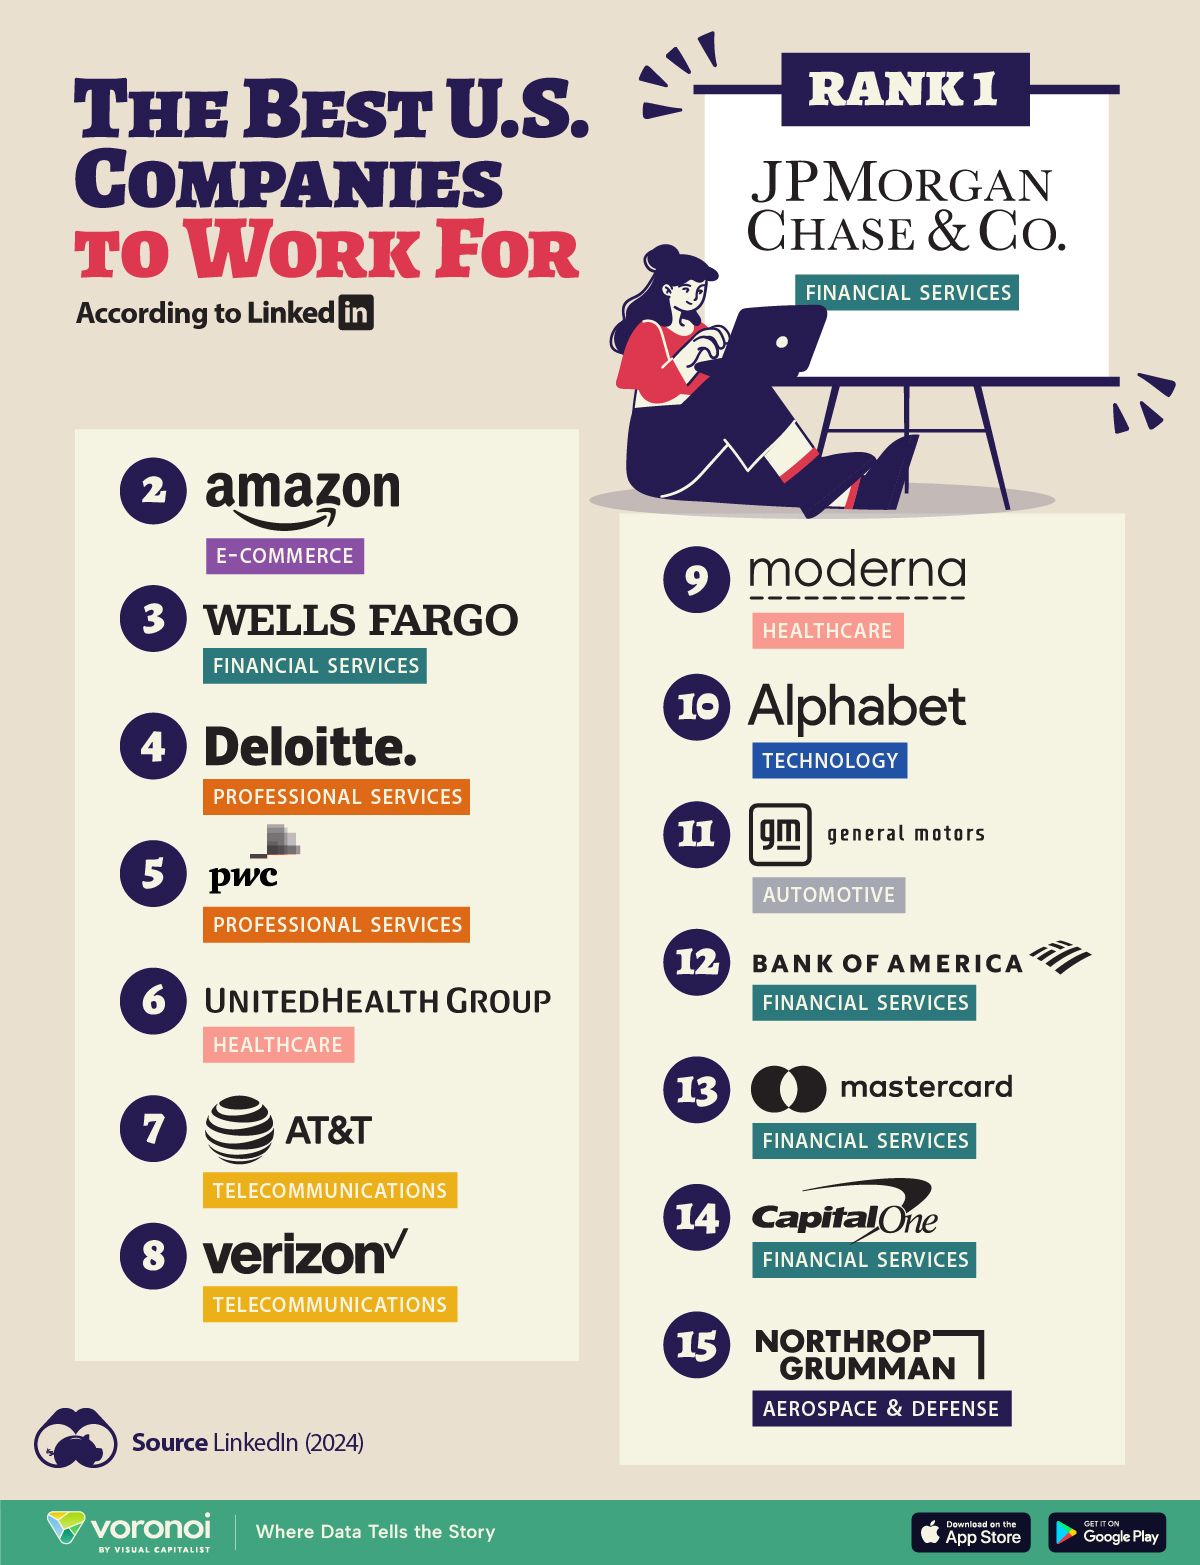
In this graphic, we list the 15 best U.S. companies to work for in 2024, according to LinkedIn data.
LinkedIn ranked companies based on eight pillars: ability to advance, skills growth, company stability, external opportunity, company affinity, gender diversity, educational background, and employee presence in the country.
To be eligible, companies must have had 5,000 or more global employees, with at least 500 in the country as of December 31, 2023.
Data and Highlights
Financial institutions dominate the ranking of the best U.S. companies to work for in 2024, with JP Morgan Chase & Co. ranking first.
| Rank | Company | Industry |
|---|---|---|
| 1 | JP Morgan Chase & Co. | Financial Services |
| 2 | Amazon | E-commerce |
| 3 | Wells Fargo | Financial Services |
| 4 | Deloitte | Professional Services |
| 5 | PwC | Professional Services |
| 6 | UnitedHealth Group | Healthcare |
| 7 | AT&T | Telecommunications |
| 8 | Verizon | Telecommunications |
| 9 | Moderna | Pharmaceuticals |
| 10 | Alphabet Inc. | Technology |
| 11 | General Motors | Automotive |
| 12 | Bank of America | Financial Services |
| 13 | Mastercard | Financial Services |
| 14 | Capital One | Financial Services |
| 15 | Northrop Grumman | Aerospace & Defense |
J.P. Morgan has a program that offers opportunities for candidates without a university degree. In fact, in 2022, 75% of job descriptions at the bank for experienced hires did not require a college degree.
Meanwhile, Deloitte and Amazon offer a variety of free training courses, including in AI.
Moderna includes in its employee package benefits to help avoid employee burnout — from subsidized commuter expenses and pop-up daycare centers, to wellness coaches.
Mastercard offers flexible work availability, with 11.5% remote and 89% hybrid options.
It’s also interesting to note that only Amazon and Alphabet made the cut from the ‘Magnificent Seven’ companies (Apple, Microsoft, Google parent Alphabet, Amazon, Nvidia, Meta Platforms, and Tesla).
See more about the best companies to work for in this infographic, which covers a separate ranking from Glassdoor.

-

 Technology6 days ago
All of the Grants Given by the U.S. CHIPS Act
-

 Uranium2 weeks ago
The World’s Biggest Nuclear Energy Producers
-

 Education2 weeks ago
How Hard Is It to Get Into an Ivy League School?
-

 Debt2 weeks ago
How Debt-to-GDP Ratios Have Changed Since 2000
-

 Sports2 weeks ago
The Highest Earning Athletes in Seven Professional Sports
-

 Science2 weeks ago
Visualizing the Average Lifespans of Mammals
-

 Brands1 week ago
How Tech Logos Have Evolved Over Time
-

 Energy1 week ago
Ranked: The Top 10 EV Battery Manufacturers in 2023