Energy
Visualizing China’s Energy Transition in 5 Charts
![]() Subscribe to the Elements free mailing list for more like this
Subscribe to the Elements free mailing list for more like this
Visualizing China’s Energy Transition in 5 Charts
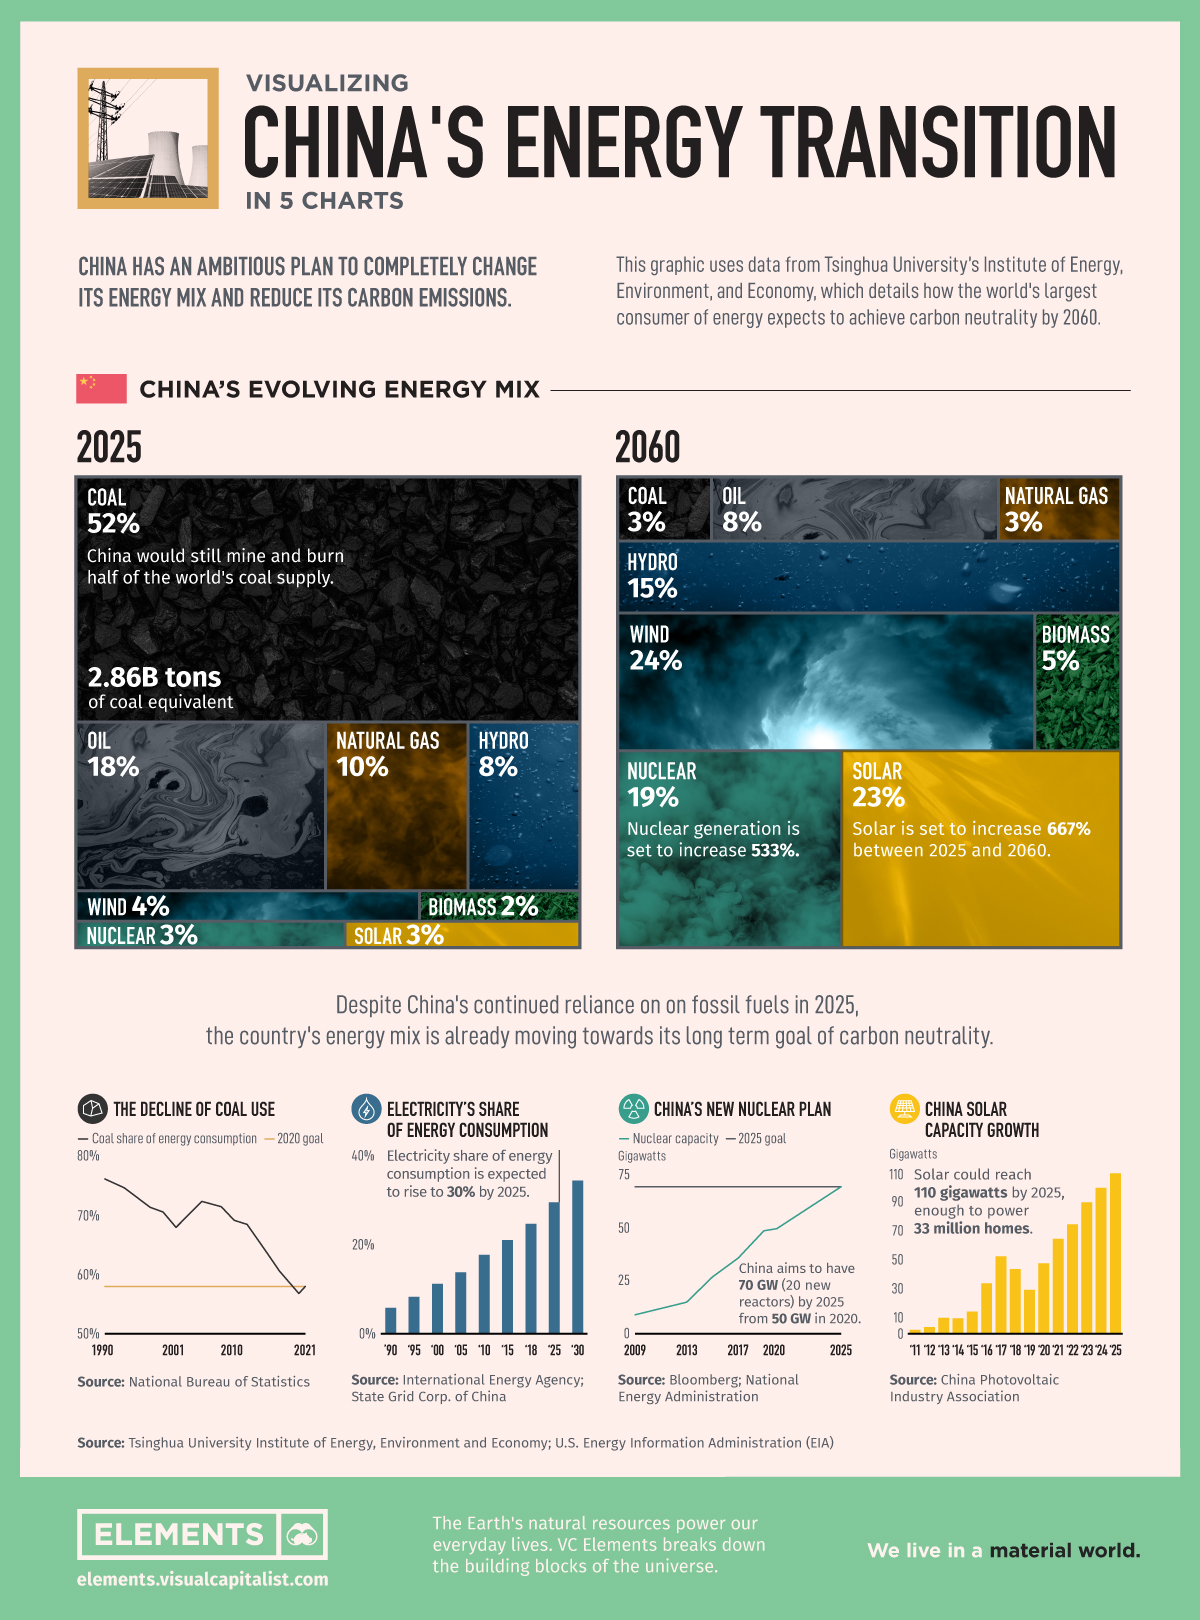
In September 2020, China’s President Xi Jinping announced the steps his nation would take to reach carbon neutrality by 2060 via videolink before the United Nations Assembly in New York.
This infographic takes a look at what this ambitious plan for China’s energy would look like and what efforts are underway towards this goal.
China’s Ambitious Plan
A carbon-neutral China requires changing the entire economy over the next 40 years, a change the IEA compares to the ambition of the reforms that industrialized the country’s economy in the first place.
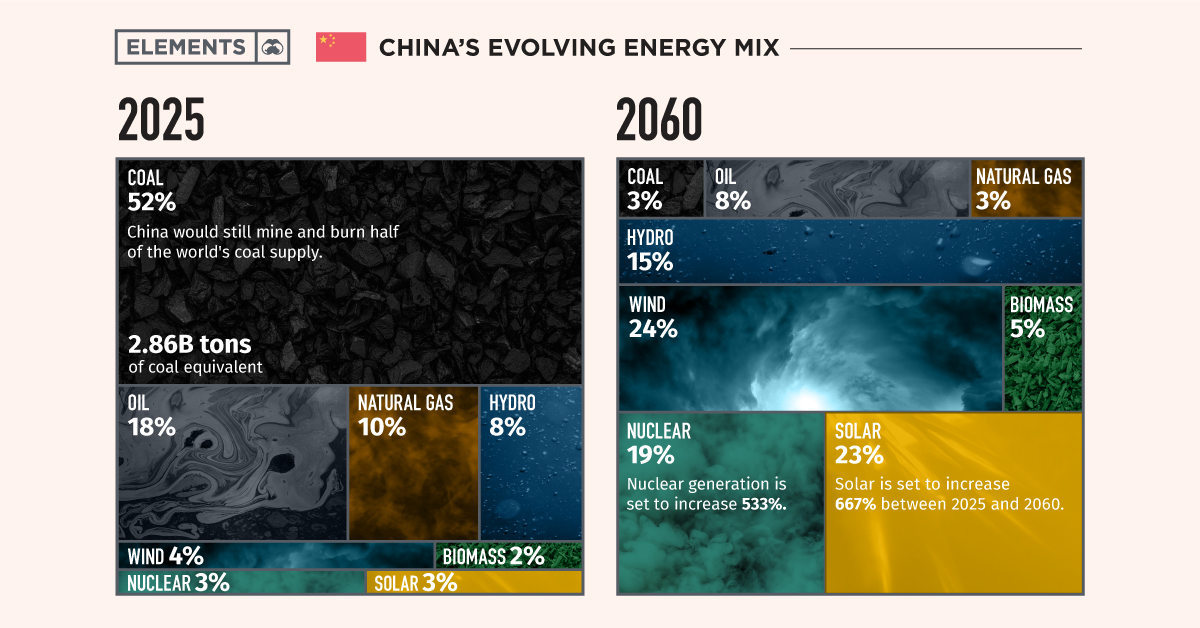
China is the world’s largest consumer of electricity, well ahead of the second place consumer, the United States. Currently, 80% of China’s energy comes from fossil fuels, but this plan envisions only 14% coming from coal, oil, and natural gas in 2060.
| Energy Source | 2025 | 2060 | % Change |
|---|---|---|---|
| Coal | 52% | 3% | -94% |
| Oil | 18% | 8% | -56% |
| Natural Gas | 10% | 3% | -70% |
| Wind | 4% | 24% | +500% |
| Nuclear | 3% | 19% | +533% |
| Biomass | 2% | 5% | +150% |
| Solar | 3% | 23% | +667% |
| Hydro | 8% | 15% | +88% |
Source: Tsinghua University Institute of Energy, Environment and Economy; U.S. EIA
According to the Carbon Brief, China’s 14th five-year plan appears to enshrine Xi’s goal. This plan outlines a general and non specific list of projects for a new energy system. It includes the construction of eight large-scale clean energy centers, coastal nuclear power, electricity transmission routes, power system flexibility, oil-and-gas transportation, and storage capacity.
Progress Towards Renewables?
While the goal seems far off in the future, China is on a trajectory towards reducing the carbon emissions of its electricity grid with declining coal usage, increased nuclear, and increased solar power capacity.
According to ChinaPower, coal fueled the rise of China with the country using 144 million tonnes of oil equivalent “Mtoe” in 1965, peaking at 1,969 Mtoe in 2013. However, its share as part of the country’s total energy mix has been declining since the 1990s from ~77% to just under ~60%.
Another trend in China’s energy transition will be the greater consumption of energy as electricity. As China urbanized, its cities expanded creating greater demand for electricity in homes, businesses, and everyday life. This trend is set to continue and approach 40% of total energy consumed by 2030 up from ~5% in 1990.
Under the new plan, by 2060, China is set to have 42% of its energy coming from solar and nuclear while in 2025 it is only expected to be 6%. China has been adding nuclear and solar capacity and expects to add the equivalent of 20 new reactors by 2025 and enough solar power for 33 million homes (110GW).
Changing the energy mix away from fossil fuels, while ushering in a new economic model is no small task.
Up to the Task?
China is the world’s factory and has relatively young industrial infrastructure with fleets of coal plants, steel mills, and cement factories with plenty of life left.
However, China also is the biggest investor in low-carbon energy sources, has access to massive technological talent, and holds a strong central government to guide the transition.
The direction China takes will have the greatest impact on the health of the planet and provide guidance for other countries looking to change their energy mixes, for better or for worse.
The world is watching…even if it’s by videolink.


Energy
Charted: 4 Reasons Why Lithium Could Be the Next Gold Rush
Visual Capitalist has partnered with EnergyX to show why drops in prices and growing demand may make now the right time to invest in lithium.


4 Reasons Why You Should Invest in Lithium
Lithium’s importance in powering EVs makes it a linchpin of the clean energy transition and one of the world’s most precious minerals.
In this graphic, Visual Capitalist partnered with EnergyX to explore why now may be the time to invest in lithium.
1. Lithium Prices Have Dropped
One of the most critical aspects of evaluating an investment is ensuring that the asset’s value is higher than its price would indicate. Lithium is integral to powering EVs, and, prices have fallen fast over the last year:
| Date | LiOH·H₂O* | Li₂CO₃** |
|---|---|---|
| Feb 2023 | $76 | $71 |
| March 2023 | $71 | $61 |
| Apr 2023 | $43 | $33 |
| May 2023 | $43 | $33 |
| June 2023 | $47 | $45 |
| July 2023 | $44 | $40 |
| Aug 2023 | $35 | $35 |
| Sept 2023 | $28 | $27 |
| Oct 2023 | $24 | $23 |
| Nov 2023 | $21 | $21 |
| Dec 2023 | $17 | $16 |
| Jan 2024 | $14 | $15 |
| Feb 2024 | $13 | $14 |
Note: Monthly spot prices were taken as close to the 14th of each month as possible.
*Lithium hydroxide monohydrate MB-LI-0033
**Lithium carbonate MB-LI-0029
2. Lithium-Ion Battery Prices Are Also Falling
The drop in lithium prices is just one reason to invest in the metal. Increasing economies of scale, coupled with low commodity prices, have caused the cost of lithium-ion batteries to drop significantly as well.
In fact, BNEF reports that between 2013 and 2023, the price of a Li-ion battery dropped by 82%.
| Year | Price per KWh |
|---|---|
| 2023 | $139 |
| 2022 | $161 |
| 2021 | $150 |
| 2020 | $160 |
| 2019 | $183 |
| 2018 | $211 |
| 2017 | $258 |
| 2016 | $345 |
| 2015 | $448 |
| 2014 | $692 |
| 2013 | $780 |

3. EV Adoption is Sustainable
One of the best reasons to invest in lithium is that EVs, one of the main drivers behind the demand for lithium, have reached a price point similar to that of traditional vehicle.
According to the Kelly Blue Book, Tesla’s average transaction price dropped by 25% between 2022 and 2023, bringing it in line with many other major manufacturers and showing that EVs are a realistic transport option from a consumer price perspective.
| Manufacturer | September 2022 | September 2023 |
|---|---|---|
| BMW | $69,000 | $72,000 |
| Ford | $54,000 | $56,000 |
| Volkswagon | $54,000 | $56,000 |
| General Motors | $52,000 | $53,000 |
| Tesla | $68,000 | $51,000 |
4. Electricity Demand in Transport is Growing
As EVs become an accessible transport option, there’s an investment opportunity in lithium. But possibly the best reason to invest in lithium is that the IEA reports global demand for the electricity in transport could grow dramatically by 2030:
| Transport Type | 2022 | 2025 | 2030 |
|---|---|---|---|
| Buses 🚌 | 23,000 GWh | 50,000 GWh | 130,000 GWh |
| Cars 🚙 | 65,000 GWh | 200,000 GWh | 570,000 GWh |
| Trucks 🛻 | 4,000 GWh | 15,000 GWh | 94,000 GWh |
| Vans 🚐 | 6,000 GWh | 16,000 GWh | 72,000 GWh |
The Lithium Investment Opportunity
Lithium presents a potentially classic investment opportunity. Lithium and battery prices have dropped significantly, and recently, EVs have reached a price point similar to other vehicles. By 2030, the demand for clean energy, especially in transport, will grow dramatically.
With prices dropping and demand skyrocketing, now is the time to invest in lithium.
EnergyX is poised to exploit lithium demand with cutting-edge lithium extraction technology capable of extracting 300% more lithium than current processes.

-

 Lithium5 days ago
Ranked: The Top 10 EV Battery Manufacturers in 2023
Asia dominates this ranking of the world’s largest EV battery manufacturers in 2023.
-

 Energy1 week ago
The World’s Biggest Nuclear Energy Producers
China has grown its nuclear capacity over the last decade, now ranking second on the list of top nuclear energy producers.
-

 Energy1 month ago
The World’s Biggest Oil Producers in 2023
Just three countries accounted for 40% of global oil production last year.
-

 Energy1 month ago
How Much Does the U.S. Depend on Russian Uranium?
Currently, Russia is the largest foreign supplier of nuclear power fuel to the U.S.
-

 Uranium2 months ago
Charted: Global Uranium Reserves, by Country
We visualize the distribution of the world’s uranium reserves by country, with 3 countries accounting for more than half of total reserves.
-

 Energy3 months ago
Visualizing the Rise of the U.S. as Top Crude Oil Producer
Over the last decade, the United States has established itself as the world’s top producer of crude oil, surpassing Saudi Arabia and Russia.

-

 Debt1 week ago
How Debt-to-GDP Ratios Have Changed Since 2000
-

 Markets2 weeks ago
Ranked: The World’s Top Flight Routes, by Revenue
-

 Countries2 weeks ago
Population Projections: The World’s 6 Largest Countries in 2075
-

 Markets2 weeks ago
The Top 10 States by Real GDP Growth in 2023
-

 Demographics2 weeks ago
The Smallest Gender Wage Gaps in OECD Countries
-

 Economy2 weeks ago
Where U.S. Inflation Hit the Hardest in March 2024
-

 Green2 weeks ago
Top Countries By Forest Growth Since 2001
-

 United States2 weeks ago
Ranked: The Largest U.S. Corporations by Number of Employees