Energy
Visualizing China’s Dominance in Battery Manufacturing (2022-2027P)
![]() Subscribe to the Elements free mailing list for more like this
Subscribe to the Elements free mailing list for more like this
Visualizing China’s Dominance in Battery Manufacturing
This was originally posted on Elements. Sign up to the free mailing list to get beautiful visualizations on natural resource megatrends in your email every week.
With the world gearing up for the electric vehicle era, battery manufacturing has become a priority for many nations, including the United States.
However, having entered the race for batteries early, China is far and away in the lead.
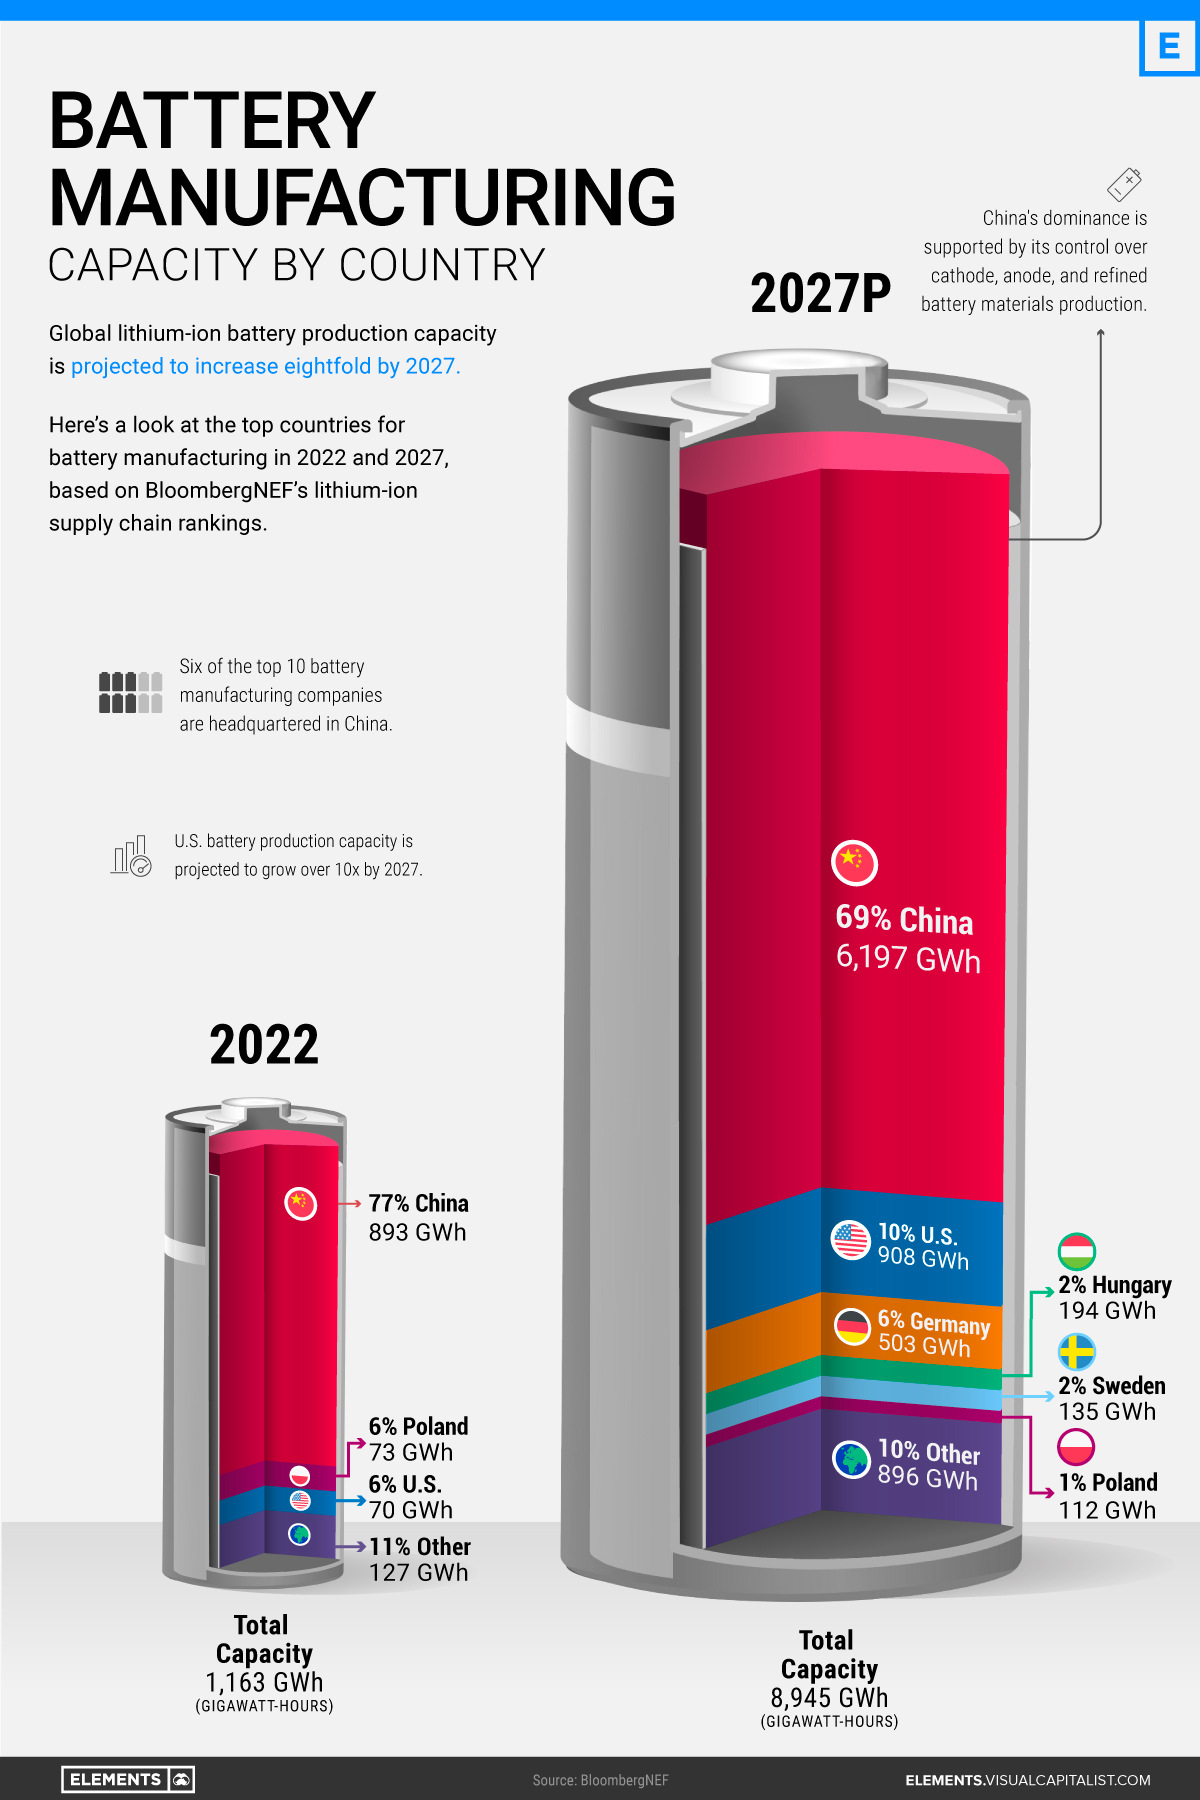
Using the data and projections behind BloombergNEF’s lithium-ion supply chain rankings, this infographic visualizes battery manufacturing capacity by country in 2022 and 2027p, highlighting the extent of China’s battery dominance.
Battery Manufacturing Capacity by Country in 2022
In 2022, China had more battery production capacity than the rest of the world combined.
| Rank | Country | 2022 Battery Cell Manufacturing Capacity, GWh | % of Total |
|---|---|---|---|
| #1 | 🇨🇳 China | 893 | 77% |
| #2 | 🇵🇱 Poland | 73 | 6% |
| #3 | 🇺🇸 U.S. | 70 | 6% |
| #4 | 🇭🇺 Hungary | 38 | 3% |
| #5 | 🇩🇪 Germany | 31 | 3% |
| #6 | 🇸🇪 Sweden | 16 | 1% |
| #7 | 🇰🇷 South Korea | 15 | 1% |
| #8 | 🇯🇵 Japan | 12 | 1% |
| #9 | 🇫🇷 France | 6 | 1% |
| #10 | 🇮🇳 India | 3 | 0.2% |
| 🌍 Other | 7 | 1% | |
| Total | 1,163 | 100% |
With nearly 900 gigawatt-hours of manufacturing capacity or 77% of the global total, China is home to six of the world’s 10 biggest battery makers. Behind China’s battery dominance is its vertical integration across the rest of the EV supply chain, from mining the metals to producing the EVs. It’s also the largest EV market, accounting for 52% of global sales in 2021.
Poland ranks second with less than one-tenth of China’s capacity. In addition, it hosts LG Energy Solution’s Wroclaw gigafactory, the largest of its kind in Europe and one of the largest in the world. Overall, European countries (including non-EU members) made up just 14% of global battery manufacturing capacity in 2022.
Although it lives in China’s shadow when it comes to batteries, the U.S. is also among the world’s lithium-ion powerhouses. As of 2022, it had eight major operational battery factories, concentrated in the Midwest and the South.
China’s Near-Monopoly Continues Through 2027
Global lithium-ion manufacturing capacity is projected to increase eightfold in the next five years. Here are the top 10 countries by projected battery production capacity in 2027:
| Rank | Country | 2027P Battery Cell Manufacturing Capacity, GWh | % of Total |
|---|---|---|---|
| #1 | 🇨🇳 China | 6,197 | 69% |
| #2 | 🇺🇸 U.S. | 908 | 10% |
| #3 | 🇩🇪 Germany | 503 | 6% |
| #4 | 🇭🇺 Hungary | 194 | 2% |
| #5 | 🇸🇪 Sweden | 135 | 2% |
| #6 | 🇵🇱 Poland | 112 | 1% |
| #7 | 🇨🇦 Canada | 106 | 1% |
| #8 | 🇪🇸 Spain | 98 | 1% |
| #9 | 🇫🇷 France | 89 | 1% |
| #10 | 🇲🇽 Mexico | 80 | 1% |
| 🌍 Other | 523 | 6% | |
| Total | 8,945 | 100% |
China’s well-established advantage is set to continue through 2027, with 69% of the world’s battery manufacturing capacity.
Meanwhile, the U.S. is projected to increase its capacity by more than 10-fold in the next five years. EV tax credits in the Inflation Reduction Act are likely to incentivize battery manufacturing by rewarding EVs made with domestic materials. Alongside Ford and General Motors, Asian companies including Toyota, SK Innovation, and LG Energy Solution have all announced investments in U.S. battery manufacturing in recent months.
Europe will host six of the projected top 10 countries for battery production in 2027. Europe’s current and future battery plants come from a mix of domestic and foreign firms, including Germany’s Volkswagen, China’s CATL, and South Korea’s SK Innovation.
Can Countries Cut Ties With China?
Regardless of the growth in North America and Europe, China’s dominance is unmatched.
Battery manufacturing is just one piece of the puzzle, albeit a major one. Most of the parts and metals that make up a battery—like battery-grade lithium, electrolytes, separators, cathodes, and anodes—are primarily made in China.
Therefore, combating China’s dominance will be expensive. According to Bloomberg, the U.S. and Europe will have to invest $87 billion and $102 billion, respectively, to meet domestic battery demand with fully local supply chains by 2030.


Energy
Charted: 4 Reasons Why Lithium Could Be the Next Gold Rush
Visual Capitalist has partnered with EnergyX to show why drops in prices and growing demand may make now the right time to invest in lithium.


4 Reasons Why You Should Invest in Lithium
Lithium’s importance in powering EVs makes it a linchpin of the clean energy transition and one of the world’s most precious minerals.
In this graphic, Visual Capitalist partnered with EnergyX to explore why now may be the time to invest in lithium.
1. Lithium Prices Have Dropped
One of the most critical aspects of evaluating an investment is ensuring that the asset’s value is higher than its price would indicate. Lithium is integral to powering EVs, and, prices have fallen fast over the last year:
| Date | LiOH·H₂O* | Li₂CO₃** |
|---|---|---|
| Feb 2023 | $76 | $71 |
| March 2023 | $71 | $61 |
| Apr 2023 | $43 | $33 |
| May 2023 | $43 | $33 |
| June 2023 | $47 | $45 |
| July 2023 | $44 | $40 |
| Aug 2023 | $35 | $35 |
| Sept 2023 | $28 | $27 |
| Oct 2023 | $24 | $23 |
| Nov 2023 | $21 | $21 |
| Dec 2023 | $17 | $16 |
| Jan 2024 | $14 | $15 |
| Feb 2024 | $13 | $14 |
Note: Monthly spot prices were taken as close to the 14th of each month as possible.
*Lithium hydroxide monohydrate MB-LI-0033
**Lithium carbonate MB-LI-0029
2. Lithium-Ion Battery Prices Are Also Falling
The drop in lithium prices is just one reason to invest in the metal. Increasing economies of scale, coupled with low commodity prices, have caused the cost of lithium-ion batteries to drop significantly as well.
In fact, BNEF reports that between 2013 and 2023, the price of a Li-ion battery dropped by 82%.
| Year | Price per KWh |
|---|---|
| 2023 | $139 |
| 2022 | $161 |
| 2021 | $150 |
| 2020 | $160 |
| 2019 | $183 |
| 2018 | $211 |
| 2017 | $258 |
| 2016 | $345 |
| 2015 | $448 |
| 2014 | $692 |
| 2013 | $780 |

3. EV Adoption is Sustainable
One of the best reasons to invest in lithium is that EVs, one of the main drivers behind the demand for lithium, have reached a price point similar to that of traditional vehicle.
According to the Kelly Blue Book, Tesla’s average transaction price dropped by 25% between 2022 and 2023, bringing it in line with many other major manufacturers and showing that EVs are a realistic transport option from a consumer price perspective.
| Manufacturer | September 2022 | September 2023 |
|---|---|---|
| BMW | $69,000 | $72,000 |
| Ford | $54,000 | $56,000 |
| Volkswagon | $54,000 | $56,000 |
| General Motors | $52,000 | $53,000 |
| Tesla | $68,000 | $51,000 |
4. Electricity Demand in Transport is Growing
As EVs become an accessible transport option, there’s an investment opportunity in lithium. But possibly the best reason to invest in lithium is that the IEA reports global demand for the electricity in transport could grow dramatically by 2030:
| Transport Type | 2022 | 2025 | 2030 |
|---|---|---|---|
| Buses 🚌 | 23,000 GWh | 50,000 GWh | 130,000 GWh |
| Cars 🚙 | 65,000 GWh | 200,000 GWh | 570,000 GWh |
| Trucks 🛻 | 4,000 GWh | 15,000 GWh | 94,000 GWh |
| Vans 🚐 | 6,000 GWh | 16,000 GWh | 72,000 GWh |
The Lithium Investment Opportunity
Lithium presents a potentially classic investment opportunity. Lithium and battery prices have dropped significantly, and recently, EVs have reached a price point similar to other vehicles. By 2030, the demand for clean energy, especially in transport, will grow dramatically.
With prices dropping and demand skyrocketing, now is the time to invest in lithium.
EnergyX is poised to exploit lithium demand with cutting-edge lithium extraction technology capable of extracting 300% more lithium than current processes.

-

 Lithium3 days ago
Ranked: The Top 10 EV Battery Manufacturers in 2023
Asia dominates this ranking of the world’s largest EV battery manufacturers in 2023.
-

 Energy1 week ago
The World’s Biggest Nuclear Energy Producers
China has grown its nuclear capacity over the last decade, now ranking second on the list of top nuclear energy producers.
-

 Energy4 weeks ago
The World’s Biggest Oil Producers in 2023
Just three countries accounted for 40% of global oil production last year.
-

 Energy1 month ago
How Much Does the U.S. Depend on Russian Uranium?
Currently, Russia is the largest foreign supplier of nuclear power fuel to the U.S.
-

 Uranium2 months ago
Charted: Global Uranium Reserves, by Country
We visualize the distribution of the world’s uranium reserves by country, with 3 countries accounting for more than half of total reserves.
-

 Energy3 months ago
Visualizing the Rise of the U.S. as Top Crude Oil Producer
Over the last decade, the United States has established itself as the world’s top producer of crude oil, surpassing Saudi Arabia and Russia.


-

 Mining1 week ago
Gold vs. S&P 500: Which Has Grown More Over Five Years?
-

 Markets2 weeks ago
Ranked: The Most Valuable Housing Markets in America
-

 Money2 weeks ago
Which States Have the Highest Minimum Wage in America?
-

 AI2 weeks ago
Ranked: Semiconductor Companies by Industry Revenue Share
-

 Markets2 weeks ago
Ranked: The World’s Top Flight Routes, by Revenue
-

 Countries2 weeks ago
Population Projections: The World’s 6 Largest Countries in 2075
-

 Markets2 weeks ago
The Top 10 States by Real GDP Growth in 2023
-

 Demographics2 weeks ago
The Smallest Gender Wage Gaps in OECD Countries