Green
How China’s Plastics Ban Threw Global Recycling into Disarray

Global Recycling: Reinventing a Broken System
First developed in the 20th century, plastics have become ubiquitous in our daily lives. Found in everything from food packaging to medical devices, this extremely versatile and cost-effective material has undoubtedly made our lives more convenient.
This convenience comes at a cost, however, and experts warn that plastics’ inability to biodegrade is taking a toll on the planet. To make matters worse, recycling infrastructure around the world is severely underdeveloped.
In this infographic from Swissquote, we recount the end of “easy” recycling, and examine the struggles that many countries are facing as they scale up their domestic capabilities.
The Single-Supplier Global Recycling Model
Since the early 1990s, developed countries have avoided the environmental costs of plastic by outsourcing their recycling to the developing world—more specifically, China.
At the time, this arrangement benefited both parties. On one hand, it was cheaper for developed countries to export their plastic waste rather than process it domestically. China, on the other hand, needed vast amounts of raw materials to fuel its burgeoning manufacturing industries. It also meant that Chinese container ships, which regularly delivered goods to countries like the U.S., would no longer return home empty-handed.
A system that relies heavily on one country can only handle so much, however, and by 2016 China was importing 7 million tonnes of recyclables and waste per year. To make matters worse, plastics production kept growing at a faster rate than the global population:
| Year | Growth in Global Plastics Production (%) | Growth in World Population (%) |
|---|---|---|
| 2013 | 3.82 | 1.19 |
| 2014 | 4.01 | 1.17 |
| 2015 | 3.54 | 1.16 |
| 2016 | 4.04 | 1.14 |
| 2017 | 3.88 | 1.12 |
| 2018 | 3.16 | 1.1 |
Source: PlasticsEurope, Worldometer
It was clear that this system would soon reach its tipping point, especially with the Chinese government largely committed to going green.
National Sword Policy
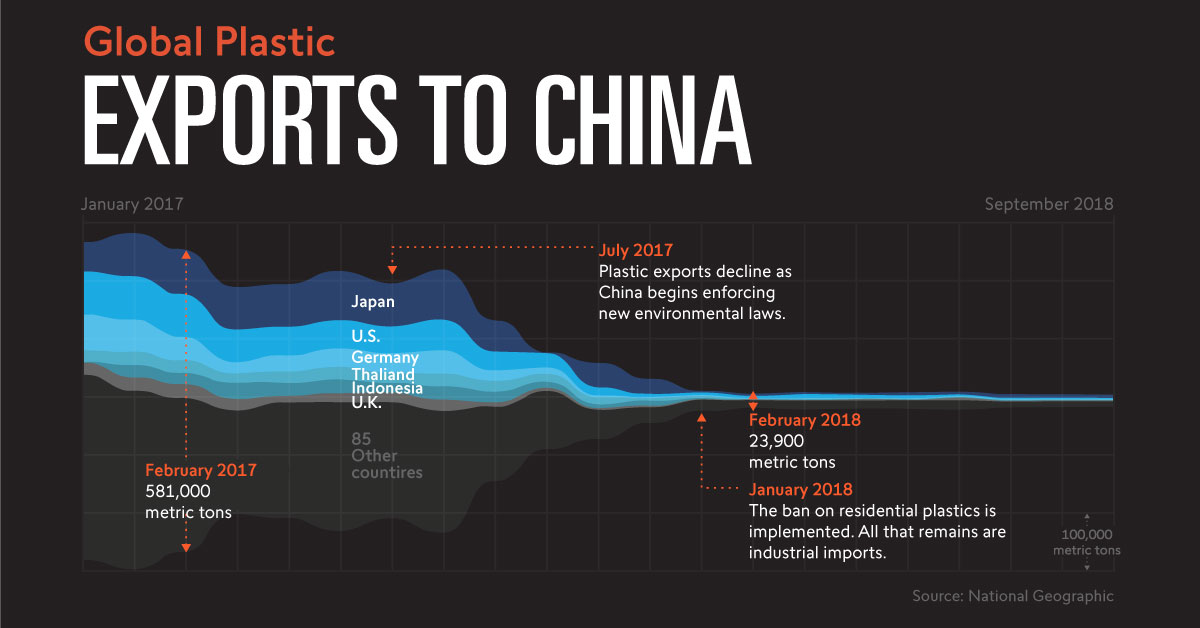
China’s solution to cutting down plastic imports was the National Sword policy, which at the start of 2018, implemented an import ban on 24 types of recyclables. The ban was extremely effective—plastic exports to China fell from 581,000 tonnes in February of 2017 to just 23,900 tonnes a year later.
All of this plastic did not simply disappear, though. Plastic-exporting countries scrambled for alternatives, and in some cases, diverted their shipments to nearby countries in Southeast Asia. Governments in the region were quick to respond, either refusing shipments or implementing bans of their own.
Richer countries are taking advantage of the looser regulations in poorer countries. They export the trash here because it’s more expensive for them to process [it] themselves back home due to the tighter laws.
—Lea Guerrero, Greenpeace Philippines
In one noteworthy case, Rodrigo Duterte, President of the Philippines, threatened to wage war on Canada if it did not take back its shipments of waste. An official later clarified this threat was not to be taken literally.
The End of “Easy” Recycling
Western countries tend to produce more plastics per capita than other countries, but are ill-prepared to begin processing their own plastic waste in a sustainable manner. One critical issue arises from their predominant method of recycling known as single-stream recycling.
Under this method, consumers place all of their recyclables into a single bin. This mixture of cardboard, plastics, and glass is then brought to a material recovery facility (MRF) to be sorted and processed. While this method makes it easier for consumers to recycle, it suffers from two weaknesses:
- Contamination: Mixing plastics, chemicals, and food waste adds extra costs to the recycling process. On average, one in four items that arrive at an MRF are too contaminated to be recycled.
- Sorting inefficiency: MRFs have a difficult time sorting through the wide variety of materials being placed into bins. Approximately one in six bottles and one in three cans are sorted incorrectly.
With outsourcing no longer an option, MRFs across the U.S. are now dealing with significantly larger volumes. To boost their capacity, some facilities have implemented artificial intelligence (AI) empowered robots that can sort items significantly faster than humans. An added bonus to reducing the human workforce is safety—MRFs frequently have some of the industry’s highest injury and illness incidence rates.
Investing in Domestic Solutions
China’s ban on foreign plastics has exposed the frailty of a single-supplier global recycling model, and is forcing many countries to begin developing their domestic infrastructure.
One emerging leader in this space is the EU, which has passed ambitious legislation to promote recycling industry investment. Recognizing the unsustainability of single-use plastics, the EU has mandated its member states to achieve a 90% collection rate for plastic bottles by 2029. It’s also set a target for all plastic packaging to be recyclable or reusable by 2030, an initiative that could create up to 200,000 new jobs.
Aside from the environmental benefits, the global recycling industry could also be a source of economic growth. It’s estimated that between 2018 and 2024 that it will grow at a CAGR of 8.6% to reach $63 billion.


Green
The Carbon Footprint of Major Travel Methods
Going on a cruise ship and flying domestically are the most carbon-intensive travel methods.


The Carbon Footprint of Major Travel Methods
This was originally posted on our Voronoi app. Download the app for free on iOS or Android and discover incredible data-driven charts from a variety of trusted sources.
Did you know that transport accounts for nearly one-quarter of global energy-related carbon dioxide (CO₂) emissions?
This graphic illustrates the carbon footprints of major travel methods measured in grams of carbon dioxide equivalent (CO₂e) emitted per person to travel one kilometer. This includes both CO₂ and other greenhouse gases.
Data is sourced from Our World in Data, the UK Government’s Department for Energy Security and Net Zero, and The International Council on Clean Transportation, as of December 2022.
These figures should be interpreted as approximations, rather than exact numbers. There are many variables at play that determine the actual carbon footprint in any individual case, including vehicle type or model, occupancy, energy mix, and even weather.
Cruise Ships are the Most Carbon-Intensive Travel Method
According to these estimates, taking a cruise ship, flying domestically, and driving alone are some of the most carbon-intensive travel methods.
Cruise ships typically use heavy fuel oil, which is high in carbon content. The average cruise ship weighs between 70,000 to 180,000 metric tons, meaning they require large engines to get moving.
These massive vessels must also generate power for onboard amenities such as lighting, air conditioning, and entertainment systems.
Short-haul flights are also considered carbon-intensive due to the significant amount of fuel consumed during initial takeoff and climbing altitude, relative to a lower amount of cruising.
| Transportation method | CO₂ equivalent emissions per passenger km |
|---|---|
| Cruise Ship | 250 |
| Short-haul flight (i.e. within a U.S. state or European country) | 246 |
| Diesel car | 171 |
| Gas car | 170 |
| Medium-haul flight (i.e. international travel within Europe, or between U.S. states) | 151 |
| Long-haul flight (over 3,700 km, about the distance from LA to NY) | 147 |
| Motorbike | 113 |
| Bus (average) | 96 |
| Plug-in hybrid | 68 |
| Electric car | 47 |
| National rail | 35 |
| Tram | 28 |
| London Underground | 27 |
| Ferry (foot passenger) | 19 |
| Eurostar (International rail) | 4.5 |
Are EVs Greener?
Many experts agree that EVs produce a lower carbon footprint over time versus traditional internal combustion engine (ICE) vehicles.
However, the batteries in electric vehicles charge on the power that comes straight off the electrical grid—which in many places may be powered by fossil fuels. For that reason, the carbon footprint of an EV will depend largely on the blend of electricity sources used for charging.
There are also questions about how energy-intensive it is to build EVs compared to a comparable ICE vehicle.

-

 Debt1 week ago
How Debt-to-GDP Ratios Have Changed Since 2000
-

 Markets2 weeks ago
Ranked: The World’s Top Flight Routes, by Revenue
-

 Countries2 weeks ago
Population Projections: The World’s 6 Largest Countries in 2075
-

 Markets2 weeks ago
The Top 10 States by Real GDP Growth in 2023
-

 Demographics2 weeks ago
The Smallest Gender Wage Gaps in OECD Countries
-

 Economy2 weeks ago
Where U.S. Inflation Hit the Hardest in March 2024
-

 Green2 weeks ago
Top Countries By Forest Growth Since 2001
-

 United States2 weeks ago
Ranked: The Largest U.S. Corporations by Number of Employees