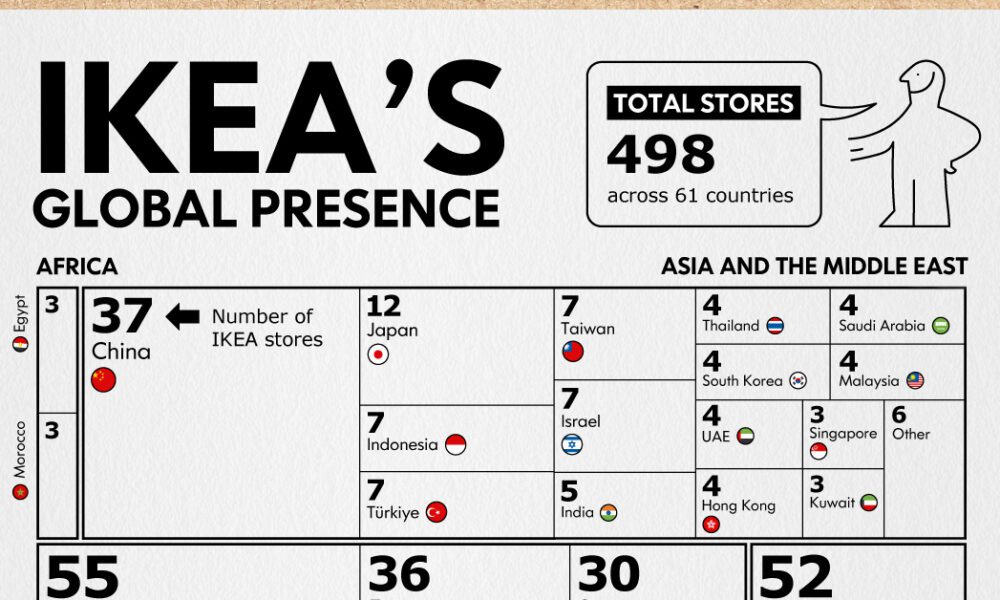
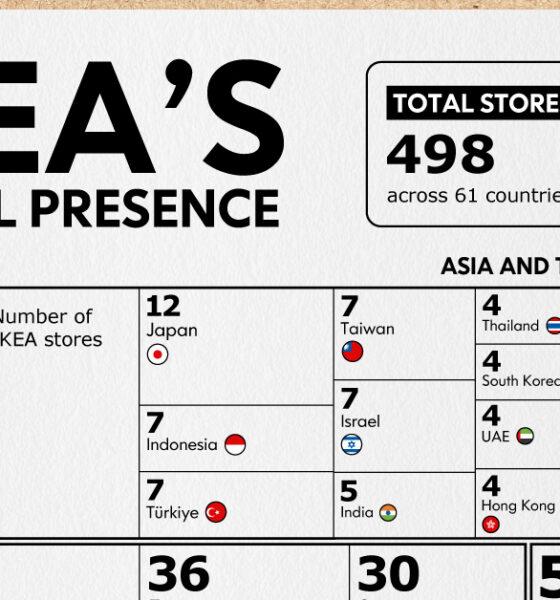
Known for their size, labyrinth-like layouts, food, and of course, functional furniture, IKEA stores have become a whole shopping experience....
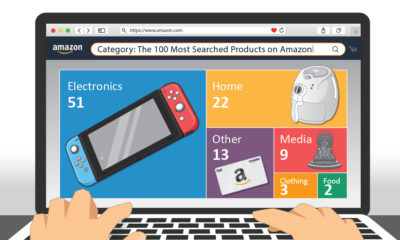

This graphic highlights the top product searches on Amazon in the U.S., providing a glimpse of what items American consumers are after.
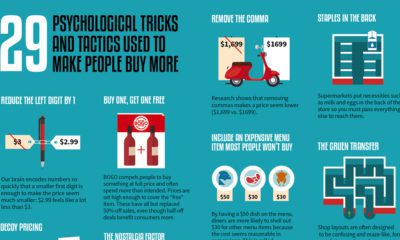

This graphic looks at 29 different psychological tricks that marketers use to try and influence consumer behavior.
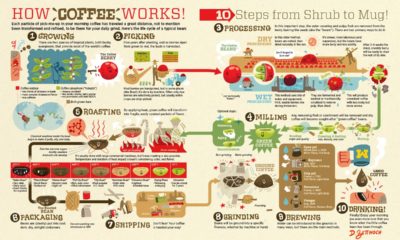

How does coffee get from a faraway plant to your morning cup? See the great journey of beans through the coffee supply chain.
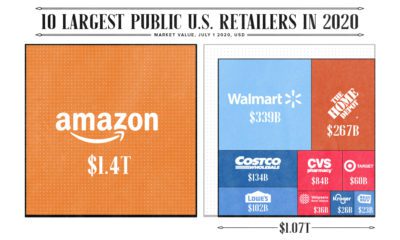

Amazon's valuation has grown by 2,830% over the last decade, and the tech giant is now worth more than the other 9 largest U.S. retailers, combined.
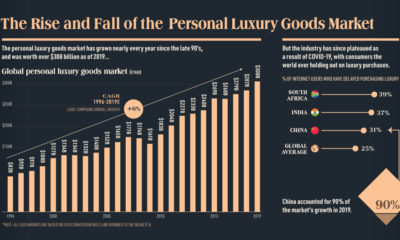

This infographic charts the rise and fall of the $308 billion global personal luxury market, and explores what the coming year holds for its growth
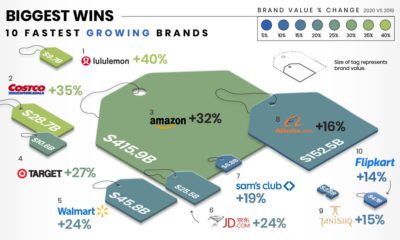

This infographic illustrates how the fastest growing and declining retail brands are attempting to stay relevant in the pandemic economy.
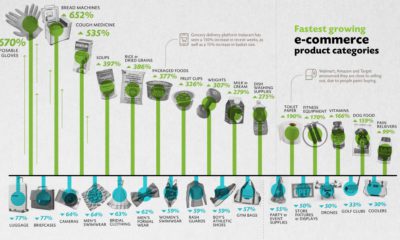

We visualize the ecommerce categories that have experienced the fastest growth, and the categories that are in decline during the COVID-19 pandemic.
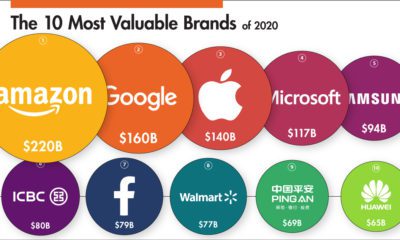

This infographic ranks some of the world’s biggest companies by brand value in 2020 and visualizes the movers and shakers over the past year.
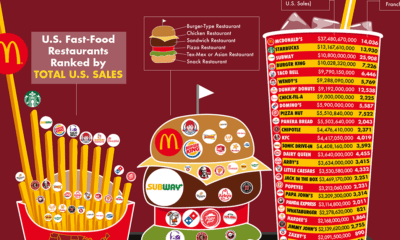

Every year, fast food chains rake in north of $200 billion in revenue per year. Here are the biggest chains, ranked by revenue and number of...
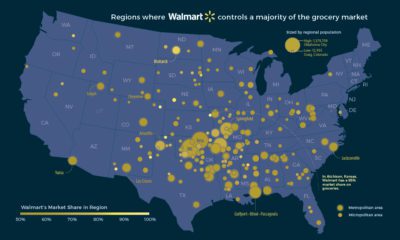

If you want to buy groceries, in some places Walmart is the only game in town. Here's a look at Walmart's domination of the U.S. grocery...


