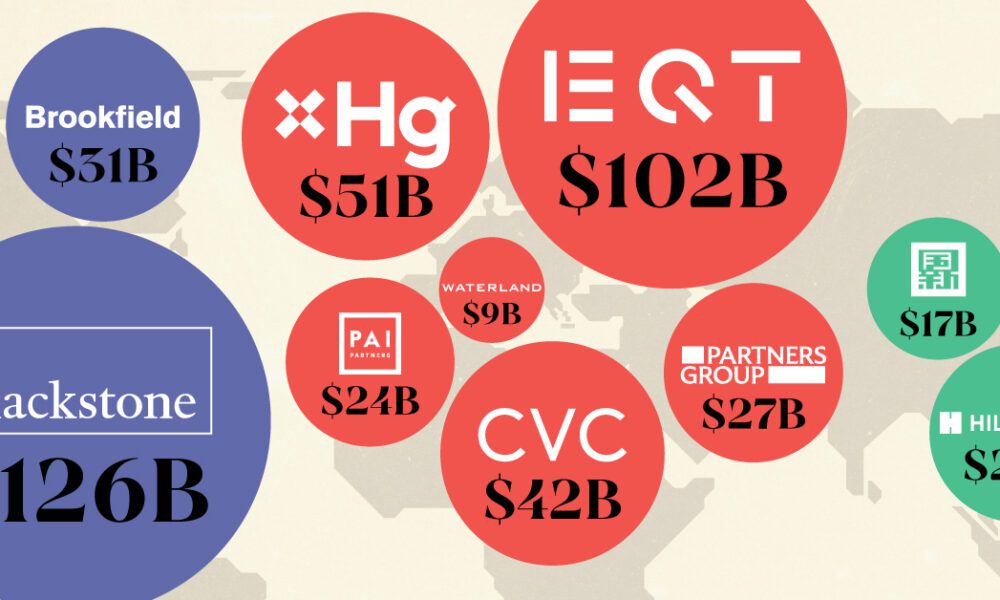
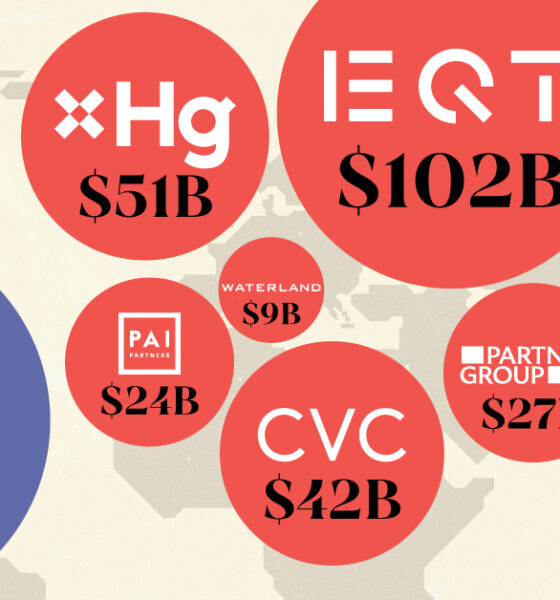
This map visualizes the leading private equity firms of major countries, ranked by capital raised over the past five years.
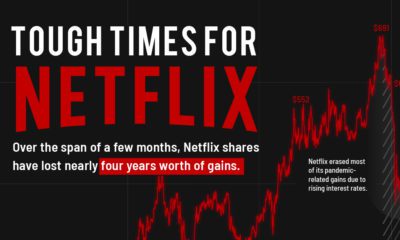

Disappointing results have pushed Netflix shares down by over 60% year-to-date. This infographic puts the company's rocky year into perspective.
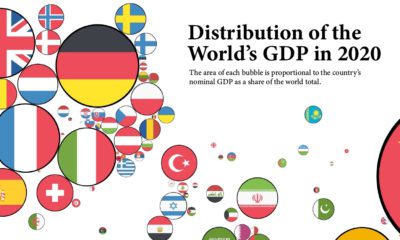

How have the world's largest economies changed over time? These graphics show countries sized by their GDP, as a share of the global total.
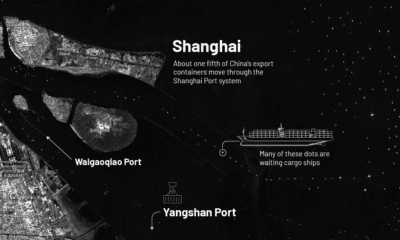

China's lockdown of Shanghai is causing massive back-ups at the world's largest container port. Hundreds of ships are now waiting at sea.


Real estate investment trusts (REITS) are a simple alternative for investors looking to gain exposure to real estate.


Do you have an eye for rare collectibles? See which items made the list of biggest auction sales in 2021.
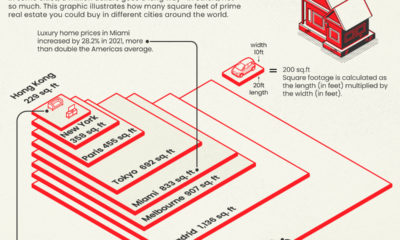

Is $1 million enough to buy you a luxury home? As this infographic shows, the answer varies greatly from city to city.
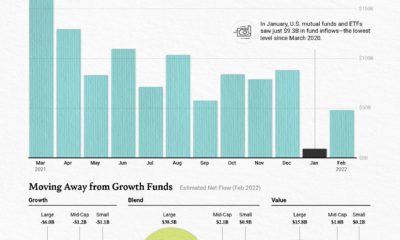

With the Ukraine crisis unfolding and rising interest rates on the horizon, investors are moving out of U.S. equity funds.
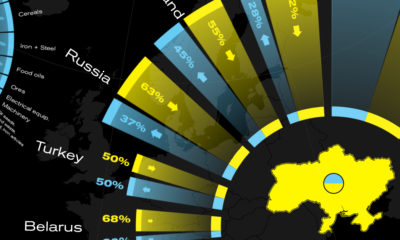

This graphic visualizes Ukraine's top international trading partners and the country's most exported and imported products in 2020.
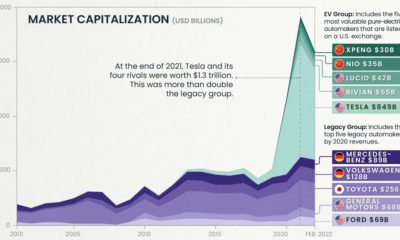

EV valuations have exploded since 2020, dwarfing those of legacy automakers like Ford and Toyota. Gain further insight with this infographic.
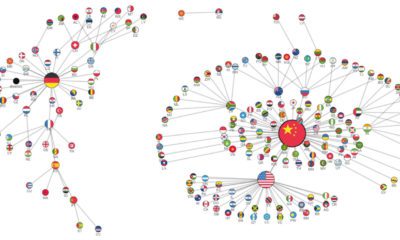

International trade has evolved drastically over the years. While China dominates now, the landscape was much different a few decades ago.


 Creator Program