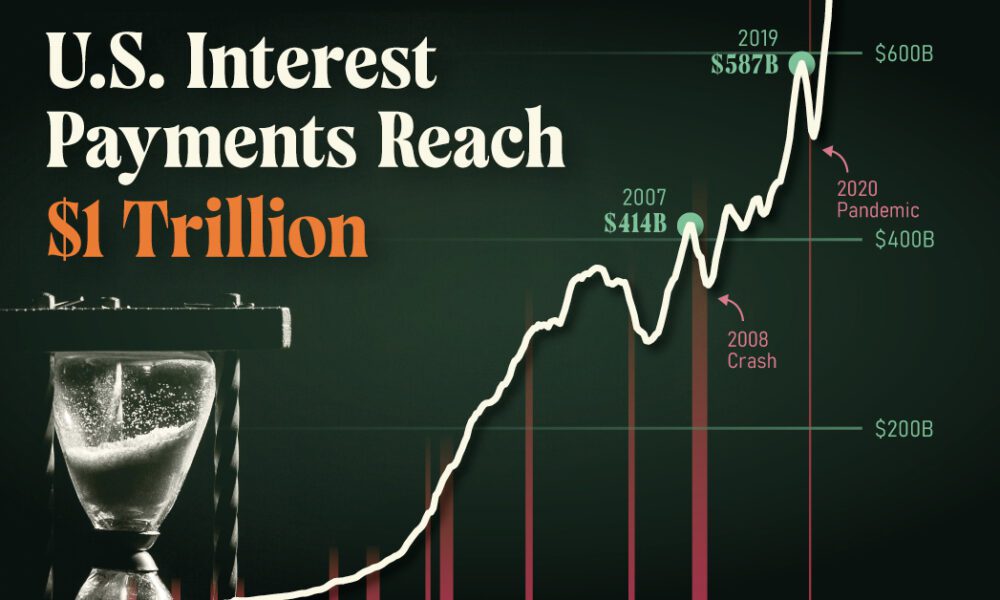
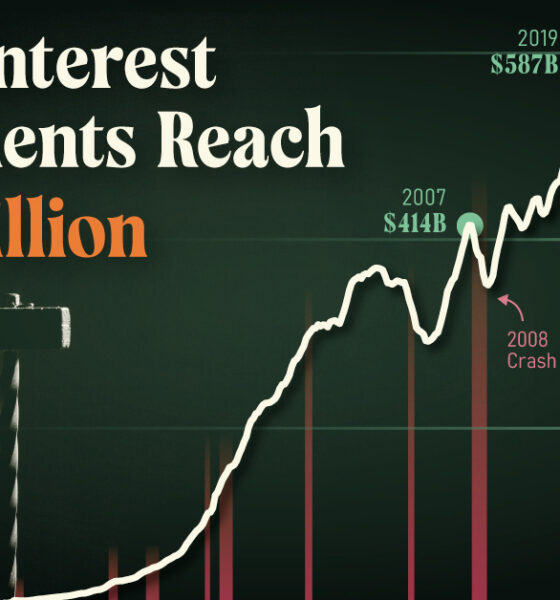
U.S. debt interest payments have surged past the $1 trillion dollar mark, amid high interest rates and an ever-expanding debt...


This infographic analyzes over 30 years of stock market performance to identify the best and worst months for gains.
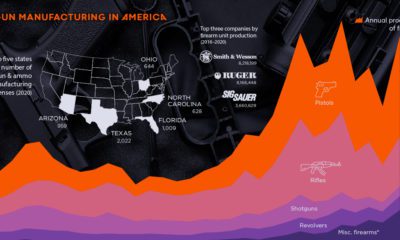

The U.S. has produced nearly 170 million firearms over the past three decades. Here are the numbers behind America's gun manufacturing sector.
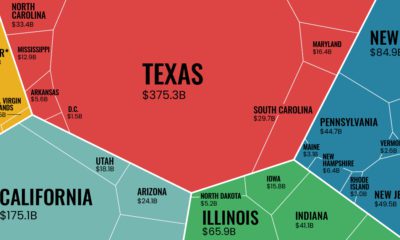

The U.S. exported $1.8 trillion worth of goods in 2021. This infographic looks at where that trade activity took place across the nation.
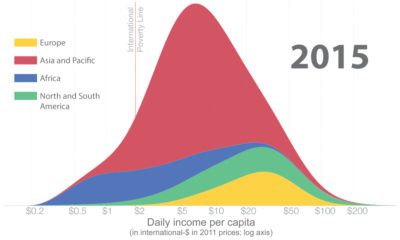

How has global income distribution changed over history? Below, we show three distinct periods since the Industrial Revolution.
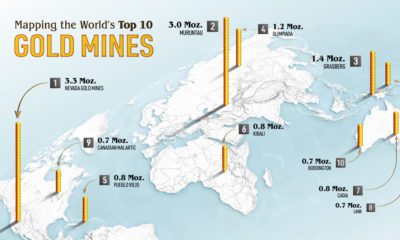

Gold mining companies produced over 3,500 tonnes of gold in 2021. Where in the world are the largest gold mines?


China’s economy reached a GDP of 114 trillion yuan ($18 trillion) in 2021, well above government targets. What sectors drove that growth?


Robust growth in mortgages has pushed U.S. consumer debt to nearly $16 trillion. Click to gain further insight into the situation.


Disappointing results have pushed Netflix shares down by over 60% year-to-date. This infographic puts the company's rocky year into perspective.


How have the world's largest economies changed over time? These graphics show countries sized by their GDP, as a share of the global total.


China's lockdown of Shanghai is causing massive back-ups at the world's largest container port. Hundreds of ships are now waiting at sea.


 Creator Program