Datastream
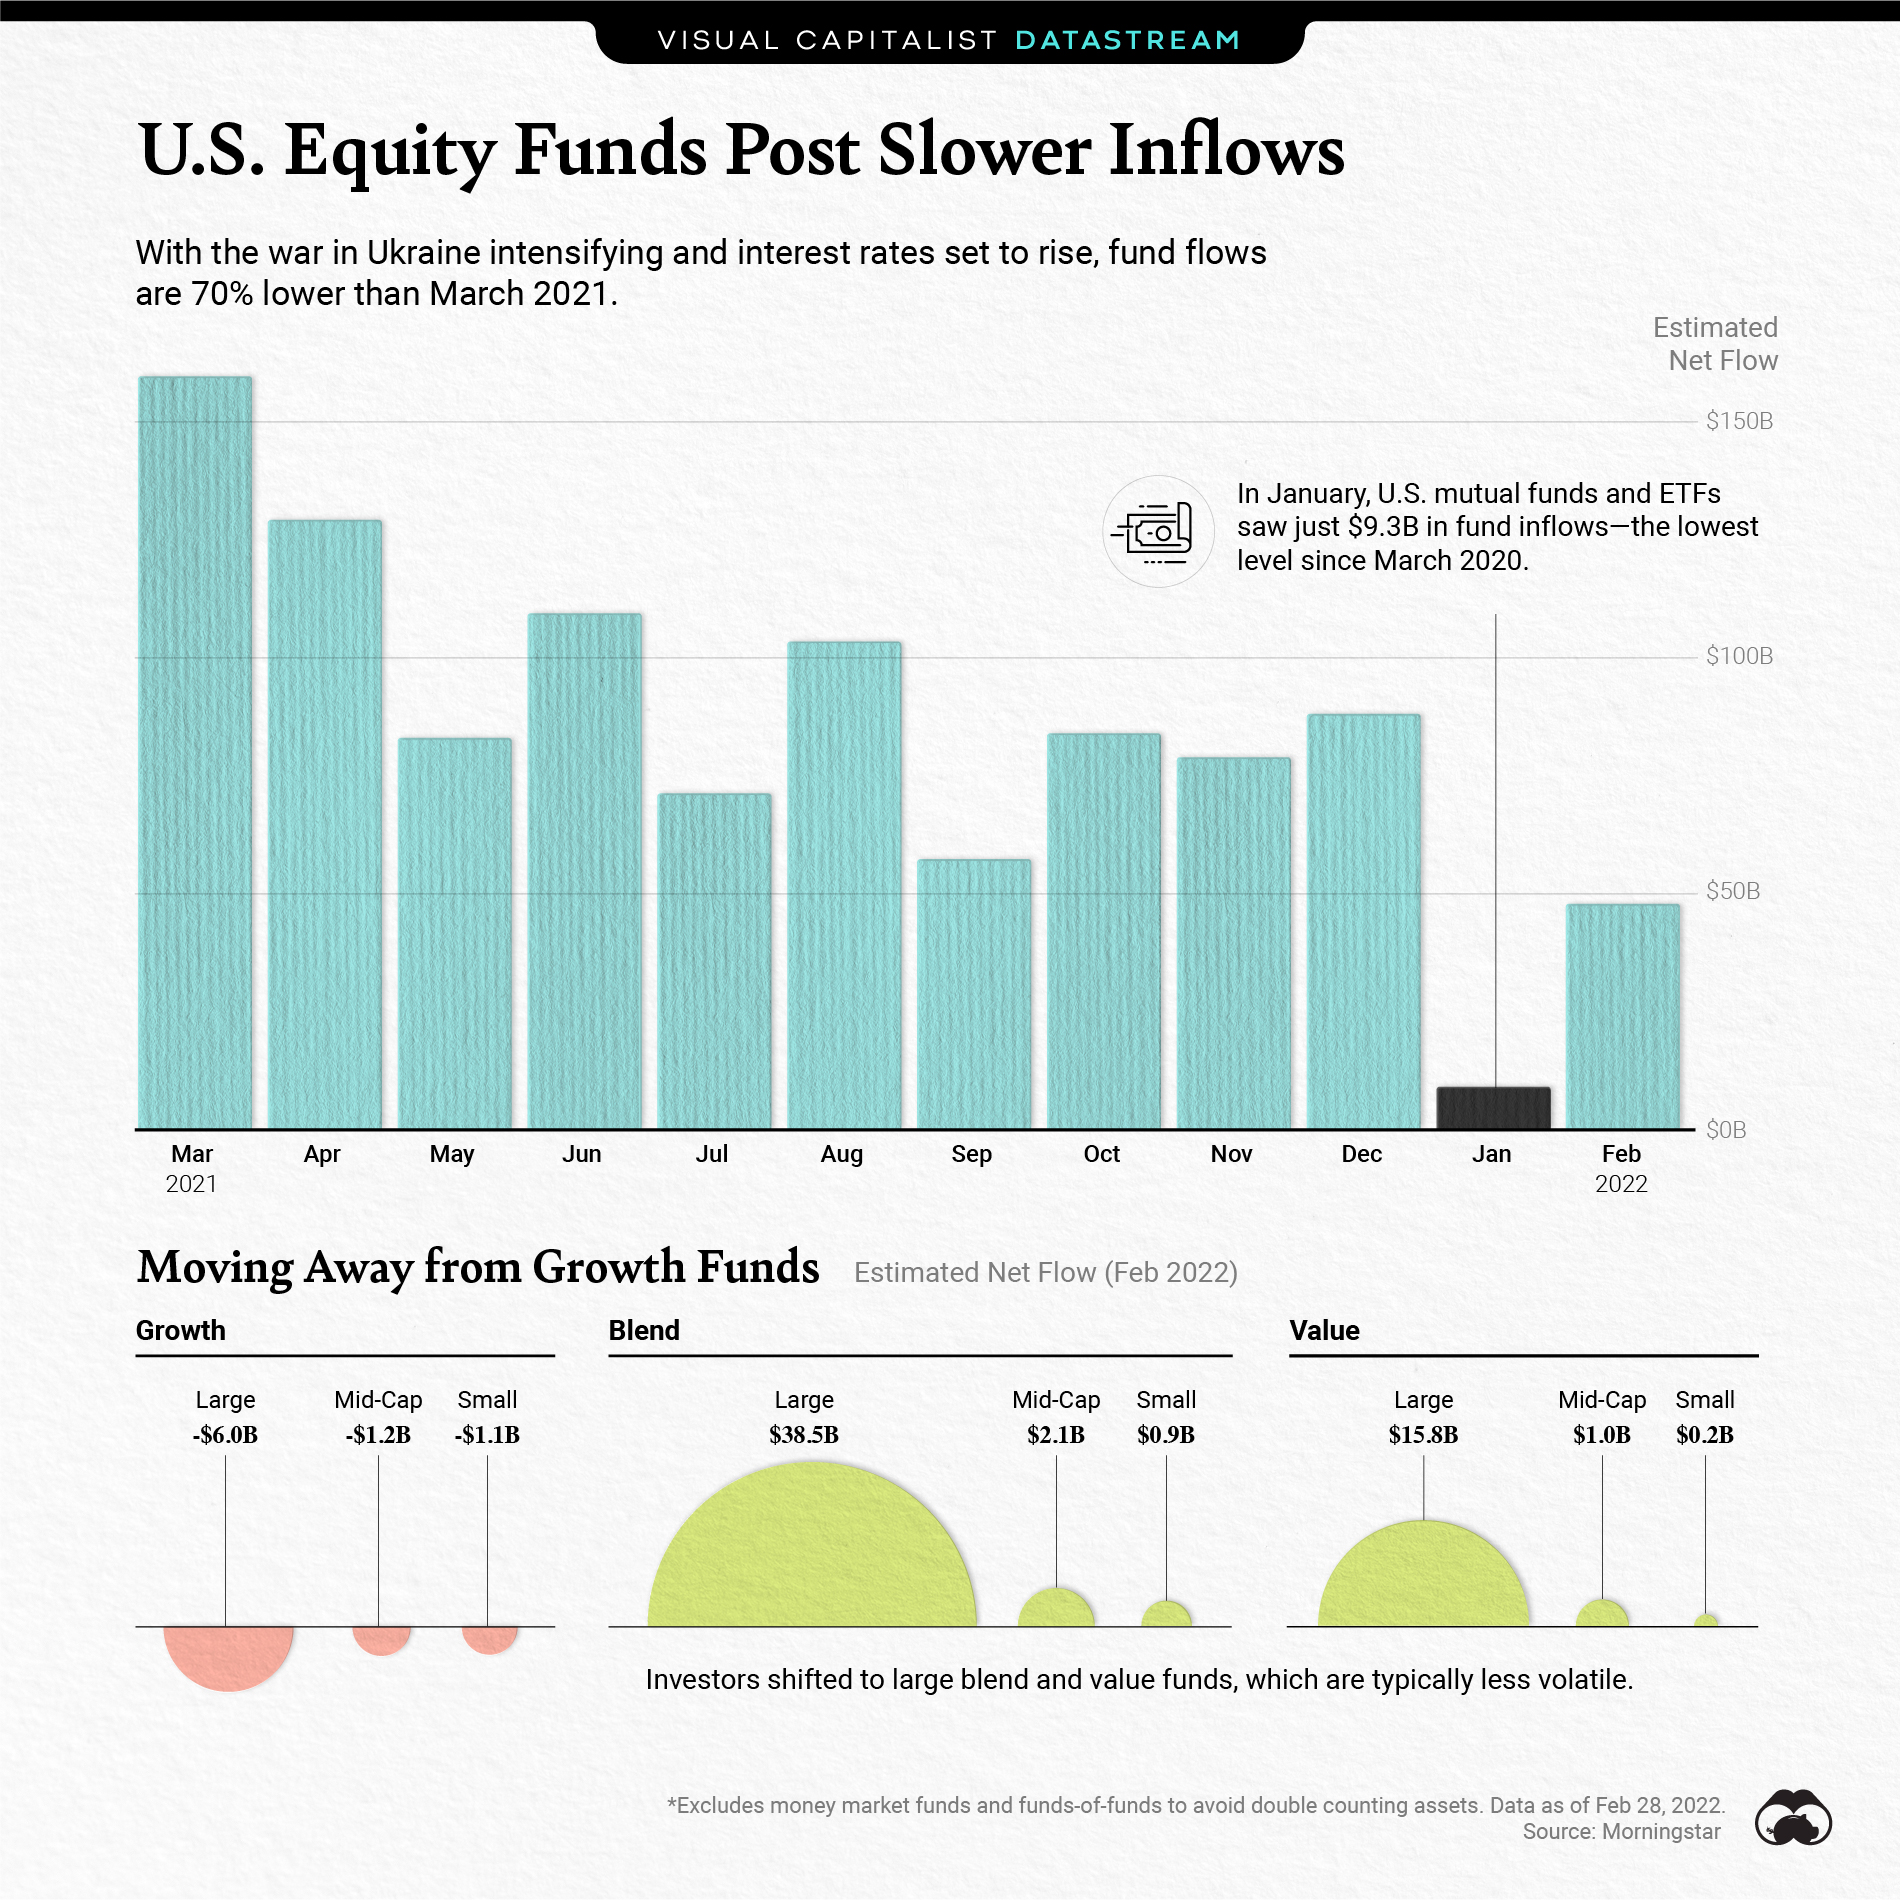
U.S. Equity Funds Post Slower Inflows
The Briefing
- U.S. equity fund flows sank to $48 billion in February, a 70% decline from March 2021
- Large growth funds continue to see outflows as Russia’s invasion of Ukraine escalates
U.S. Equity Funds Post Slower Inflows
Investors are bracing for several interest rate hikes amid a Russia-Ukraine war.
In February, U.S. equity fund flows hit $48 billion, a 70% decline from the year before. In the previous month, U.S. equity fund flows hit their lowest level since the pandemic began.
With data from Morningstar, we show how the invasion of Ukraine and a rising rate environment has affected U.S. equity fund flows.
Risk-Off Environment
In January, investors shed a record $23 billion from large growth funds, the highest level since 2017. This trend continued in February as investors sought out lower-risk investments.
Growth stocks historically tend to outperform when interest rates are declining. When the price of capital is low, companies borrow and expand operations at a lower cost.
The reverse is true when rates rise, putting pressure on corporate earnings and equity valuations. In March 2022, the Fed raised interest rates for the first time since 2018.
Growth funds also tend to be more volatile during market selloffs. So far in 2022, the Cboe Volatility Index (VIX) is up more than 40%.
| Fund Category | January 2022 Estimated Net Flow | February Estimated Net Flow |
|---|---|---|
| Large Growth | -$23.2B | -$6.0B |
| Mid-Cap Growth | -$3.5B | -$1.2B |
| Small Growth | -$2.7B | -$1.1B |
| Large Blend | -$3.5B | $38.5B |
| Mid-Cap Blend | $0.7B | $2.1B |
| Small Blend | -$0.4B | $0.9B |
| Large Value | $10.9B | $15.8B |
| Mid-Cap Value | $0.1B | $1.0B |
| Small Value | $1.6B | $0.2B |
Large blend funds saw the highest inflows, at $38.5 billion, while large cap value funds saw a moderate $15.8 billion in inflows.
Unlike growth funds, value funds tend to outperform when interest rates are rising. Over the last decade, growth funds, marked by low-margins and high valuations have shown stronger performance than value.
U.S. Equity Funds by Sector
Which U.S. equity fund sectors saw the highest inflows and outflows?
| Sector Category | Estimated Net Flow – Feb 2022 | Estimated Net Flow – YTD 2022 |
|---|---|---|
| Equity Energy | $1.7B | $5.2B |
| Consumer Defensive | $1.0B | $3.6B |
| Natural Resources | $0.8B | $1.5B |
| Consumer Cyclical | -$1.5B | -$3.7B |
| Health | -$1.8B | -$3.7B |
| Technology | -$1.9B | -$6.8B |
Energy, consumer defensive, and natural resources—all typically cyclical, value-skewed sectors—saw the highest inflows at $1.7 billion, $1.0 billion, and $0.8 billion, respectively. Gas prices in the U.S. have hit record prices amid supply pressures from the war.
Meanwhile, investors withdrew $1.9 billion from technology sector funds in February, the highest out of any sector category. Year-to-date, technology sector funds have seen almost $7 billion in net outflows.
As investors veer away from growth sectors, they are flocking to safer assets, like money market funds as the humanitarian crisis in Ukraine unfolds.
Where does this data come from?
Source: Morningstar February 2022 U.S. Fund Flows Report, March 2022.


Datastream
Can You Calculate Your Daily Carbon Footprint?
Discover how the average person’s carbon footprint impacts the environment and learn how carbon credits can offset your carbon footprint.


The Briefing
- A person’s carbon footprint is substantial, with activities such as food consumption creating as much as 4,500 g of CO₂ emissions daily.
- By purchasing carbon credits from Carbon Streaming Corporation, you can offset your own emissions and fund positive climate action.
Your Everyday Carbon Footprint
While many large businesses and countries have committed to net-zero goals, it is essential to acknowledge that your everyday activities also contribute to global emissions.
In this graphic, sponsored by Carbon Streaming Corporation, we will explore how the choices we make and the products we use have a profound impact on our carbon footprint.
Carbon Emissions by Activity
Here are some of the daily activities and products of the average person and their carbon footprint, according to Clever Carbon.
| Household Activities & Products | CO2 Emissions (g) |
|---|---|
| 💡 Standard Light Bulb (100 watts, four hours) | 172 g |
| 📱 Mobile Phone Use (195 minutes per day)* | 189 g |
| 👕 Washing Machine (0.63 kWh) | 275 g |
| 🔥 Electric Oven (1.56 kWh) | 675 g |
| ♨️ Tumble Dryer (2.5 kWh) | 1,000 g |
| 🧻 Toilet Roll (2 ply) | 1,300 g |
| 🚿 Hot Shower (10 mins) | 2,000 g |
| 🚙 Daily Commute (one hour, by car) | 3,360 g |
| 🍽️ Average Daily Food Consumption (three meals of 600 calories) | 4,500 g |
| *Phone use based on yearly use of 69kg per the source, Reboxed | |
Your choice of transportation plays a crucial role in determining your carbon footprint. For instance, a 15 km daily commute to work on public transport generates an average of 1,464 g of CO₂ emissions. Compared to 3,360 g—twice the volume for a journey the same length by car.
By opting for more sustainable modes of transport, such as cycling, walking, or public transportation, you can significantly reduce your carbon footprint.
Addressing Your Carbon Footprint
One way to compensate for your emissions is by purchasing high-quality carbon credits.
Carbon credits are used to help fund projects that avoid, reduce or remove CO₂ emissions. This includes nature-based solutions such as reforestation and improved forest management, or technology-based solutions such as the production of biochar and carbon capture and storage (CCS).
While carbon credits offer a potential solution for individuals to help reduce global emissions, public awareness remains a significant challenge. A BCG-Patch survey revealed that only 34% of U.S. consumers are familiar with carbon credits, and only 3% have purchased them in the past.
About Carbon Streaming
By financing the creation or expansion of carbon projects, Carbon Streaming Corporation secures the rights to future carbon credits generated by these sustainable projects. You can then purchase these carbon credits to help fund climate solutions around the world and compensate for your own emissions.
Ready to get involved?
>> Learn more about purchasing carbon credits at Carbon Streaming

-

 Real Estate2 weeks ago
Visualizing America’s Shortage of Affordable Homes
-

 Technology1 week ago
Ranked: Semiconductor Companies by Industry Revenue Share
-

 Money1 week ago
Which States Have the Highest Minimum Wage in America?
-

 Real Estate1 week ago
Ranked: The Most Valuable Housing Markets in America
-

 Business2 weeks ago
Charted: Big Four Market Share by S&P 500 Audits
-

 AI2 weeks ago
The Stock Performance of U.S. Chipmakers So Far in 2024
-

 Misc2 weeks ago
Almost Every EV Stock is Down After Q1 2024
-

 Money2 weeks ago
Where Does One U.S. Tax Dollar Go?