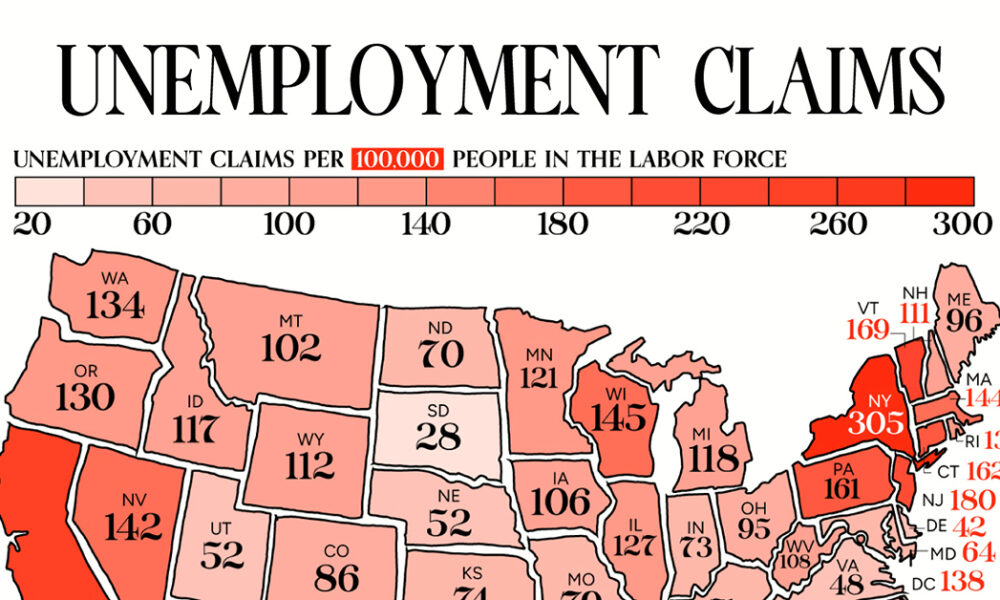
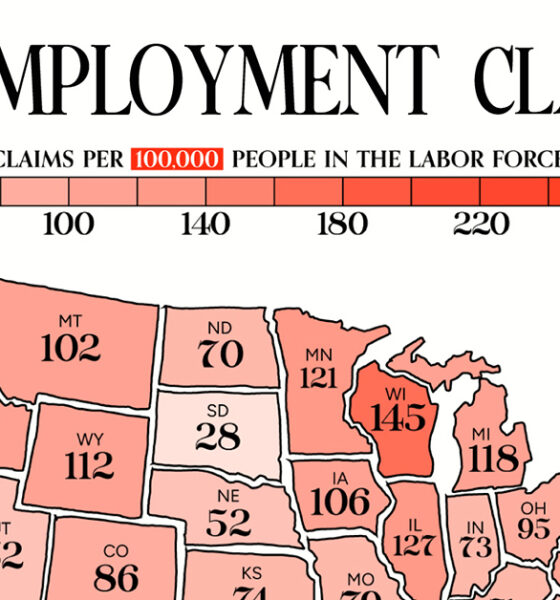
This visual heatmap of unemployment claims by state highlights New York, California, and Alaska leading the country by a wide...
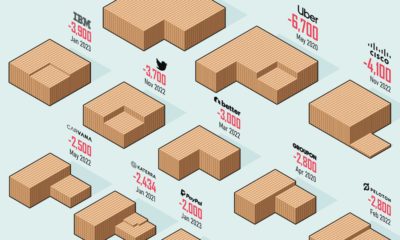

How bad are the current layoffs in the tech sector? This visual reveals the 20 biggest tech layoffs since the start of the pandemic.
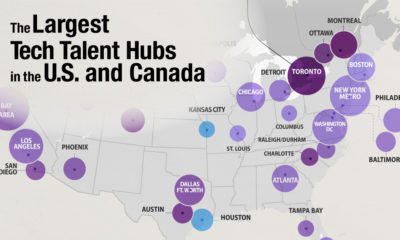

6.5 million skilled tech workers currently work in the U.S. and Canada. Here we look at the largest tech hubs across the two countries
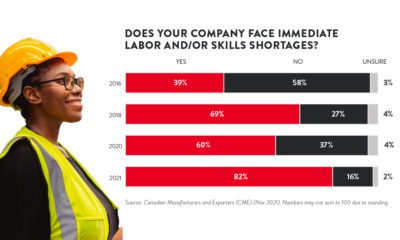

More than four in five manufacturers say they face an immediate skills or labor shortage. What steps can be taken to address the shortages?
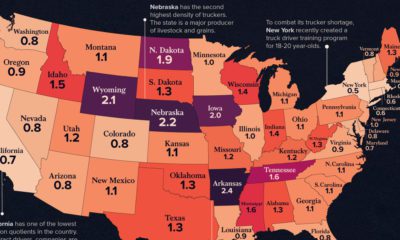

See how America's 1.8 million truckers are distributed across the nation in these two heatmap visualizations.


Corporate finance oversees trillions of dollars and makes modern markets and economies possible, but who are the main players?
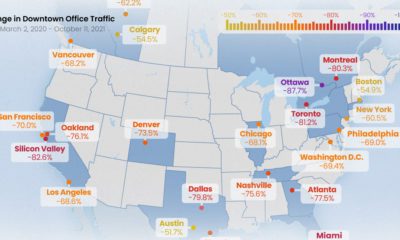

All North American downtowns are facing a sluggish recovery, but some are still seeing more than 80% less foot traffic than pre-pandemic times
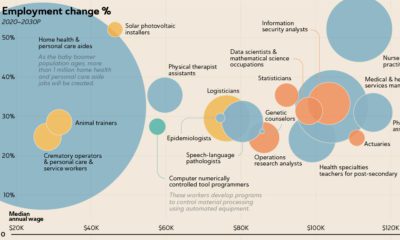

The U.S. Bureau of Labor Statistics predicts an overall job growth rate of 7.7%. Here, we show the fastest growing jobs and how much they pay.
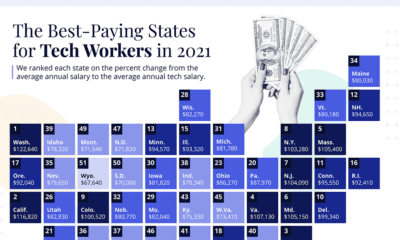

In America, tech jobs pay about 61% more than the average salary. Here's a look at which states have the highest tech salaries.


Most people have had bad bosses, but is your boss toxic? This flowchart helps you discover if you have a toxic boss and what to do...
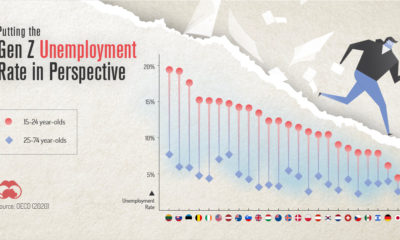

COVID-19 has impacted everyone, but one generation is taking it harder than the others. This graphic reveals the Gen Z unemployment rate.


