

Lions, tigers, and bears, oh my!—these animals do not feature on this list of popular American household pets.
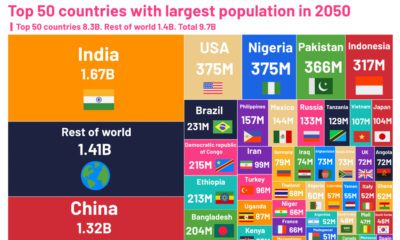

These charts highlight the changing world population between 2022 and 2050, showing which countries are growing—and shrinking—the fastest.
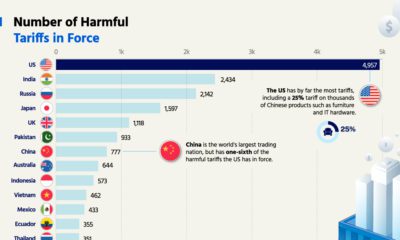

The U.S. has by far the most harmful tariffs, with nearly 5,000 in force. Which economy has the least tariffs?


How has inflation impacted everyday goods like milk, flour, or fuel? This chart shows the annual change in the price of basic daily goods.
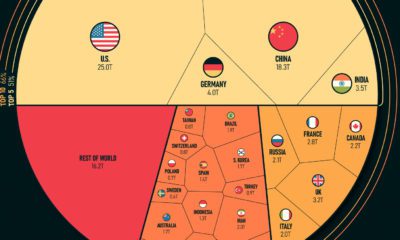

Just five countries make up more than half of the global economy. The top 25 countries make up a staggering 84% of the world's GDP.


This map juxtaposes nations and Indian states to provide a new perspective on the world's soon-to-be most populous country
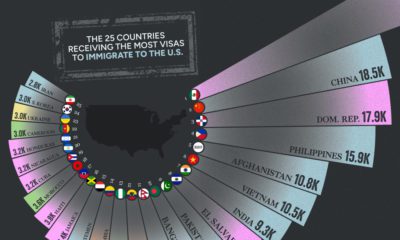

Every year, there are hundreds of thousands of U.S. immigration visas issued by the government. See which countries receive the most in this visualization.
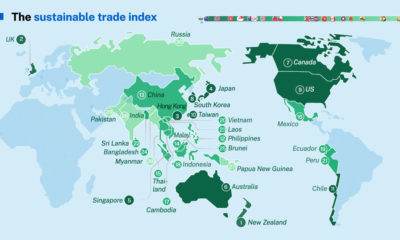

See which economies have the most sustainable trade policies in the Hinrich Foundation's 2022 Sustainable Trade Index.
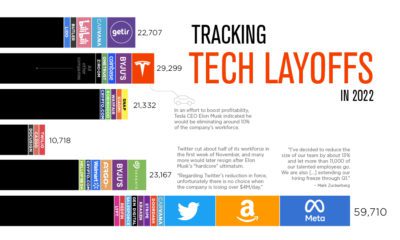

Mass layoffs in the tech industry have accelerated as the end of 2022 approaches. See which companies let people go in 2022.
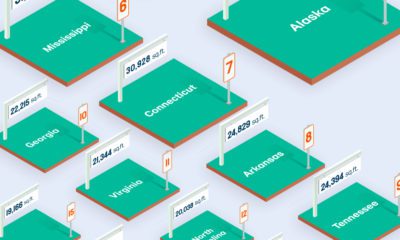

Lot sizes in the U.S. are shrinking compared to a few decades ago. Here’s a look at the median lot size in every U.S. state.
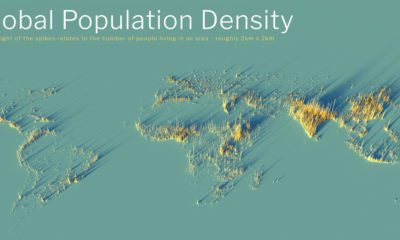

What does population density look like on a global scale? These detailed 3D renders illustrate our biggest urban areas and highlight population trends.


 Creator Program