Introducing the 2022 Sustainable Trade Index
Introducing the 2022 Sustainable Trade Index
History has proven that trade can be a powerful engine for economic growth.
It’s for this reason that participation in the international trading system has become a priority for national governments. In many cases, however, economic growth has superseded any concerns about the environment or society.
It is therefore important to measure whether an economy is trading in a sustainable manner, and whether it can continue doing so.
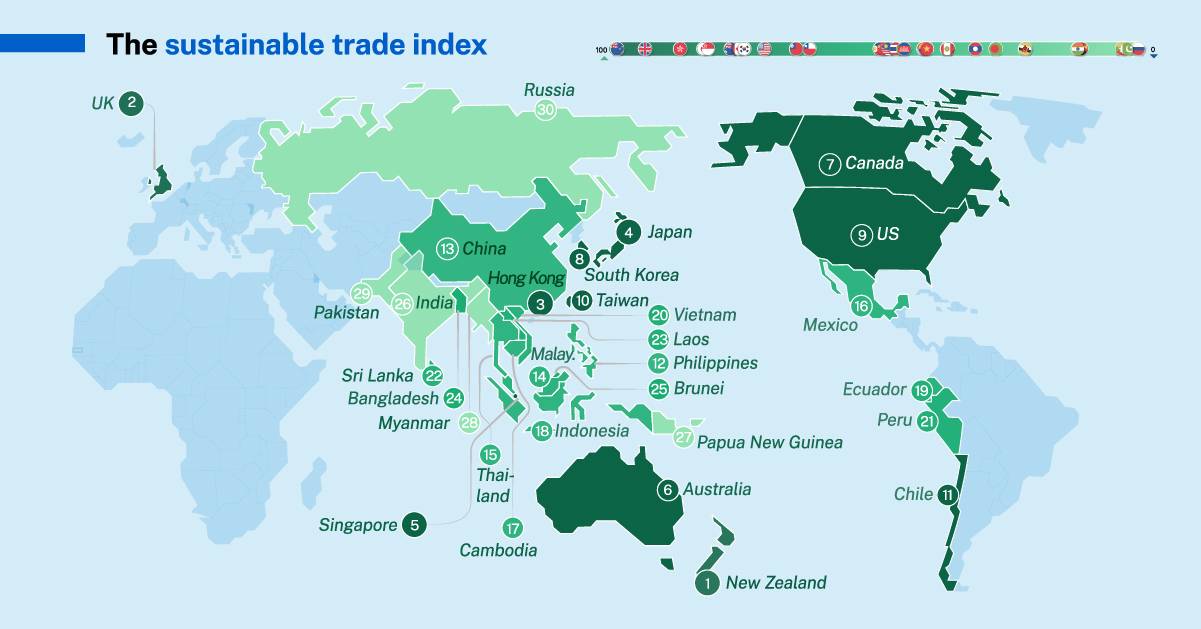
This infographic from the Hinrich Foundation introduces their 2022 Sustainable Trade Index (STI), which was developed in conjunction with the IMD World Competitiveness Center.
Who is This Index For?
The purpose of the STI is to stimulate meaningful discussions about the linkages between trade and sustainability. It serves as a practical tool for:
- Governments and policymakers targeting economic growth through trade.
- Researchers who are working on trade or sustainability issues and are looking to root their work in quantitative datasets.
- Communities that want information about ways in which trade impacts them.
A New Index Built Upon a Recognized Tradition
The STI has been produced biannually since 2016 and has historically covered 19 Asian economies with the U.S. as a benchmark.
For this year, its scope has been expanded to cover 30 major economies worldwide. Altogether, this new group of constituents cover 69% of global GDP, and 63% of global population. Going forward, the STI will also be produced on an annual basis.
Each economy is scored across three equally weighted pillars of trade sustainability, which are supported by 70 individual indicators. These are detailed below.
1. Economic Pillar
The economic pillar measures an economy’s ability to ensure and promote economic growth through international trade. It’s based on 7 indicators and 29 sub-indicators, and focuses on areas such as infrastructure and export diversification.
2. Societal Pillar
The societal pillar captures social factors that contribute to an economy’s capacity to trade internationally over the long term. It’s based on 4 indicators and 13 sub-indicators, and focuses on areas such as education and labor standards.
3. Environmental Pillar
The environmental pillar measures the extent to which an economy engages in trade that is environmentally sustainable. It’s based on 8 indicators and 9 sub-indicators, with a focus on natural resources and pollution controls.
Overall Ranking
Each economy’s pillar scores are averaged to obtain an overall score, which is then rescaled between 0 to 100. This means that the best performing economy receives a score of 100, while the lowest performing economy receives 0.
The following table lists the top-level scores of all 30 economies:
| Rank | Economy | Score |
|---|---|---|
| 1 | 🇳🇿 New Zealand | 100 |
| 2 | 🇬🇧 UK | 94.4 |
| 3 | 🇭🇰 Hong Kong | 87.9 |
| 4 | 🇯🇵 Japan | 83.1 |
| 5 | 🇸🇬 Singapore | 82.7 |
| 6 | 🇦🇺 Australia | 78.2 |
| 7 | 🇨🇦 Canada | 76.5 |
| 8 | 🇰🇷 South Korea | 75.4 |
| 9 | 🇺🇸 U.S. | 71.6 |
| 10 | 🇹🇼 Taiwan | 65.5 |
| 11 | 🇨🇱 Chile | 62.9 |
| 12 | 🇵🇭 Philippines | 49.5 |
| 13 | 🇨🇳 China | 49.4 |
| 14 | 🇲🇾 Malaysia | 48 |
| 15 | 🇹🇭 Thailand | 46.5 |
| 16 | 🇲🇽 Mexico | 45.2 |
| 17 | 🇰🇭 Cambodia | 45 |
| 18 | 🇮🇩 Indonesia | 41.2 |
| 19 | 🇪🇨 Ecuador | 41 |
| 20 | 🇻🇳 Vietnam | 40.5 |
| 21 | 🇵🇪 Peru | 36.7 |
| 22 | 🇱🇰 Sri Lanka | 36.5 |
| 23 | 🇱🇦 Laos | 31.3 |
| 24 | 🇧🇩 Bangladesh | 27.4 |
| 25 | 🇧🇳 Brunei | 21.8 |
| 26 | 🇮🇳 India | 11.7 |
| 27 | 🇵🇬 Papua New Guinea | 11.3 |
| 28 | 🇲🇲 Myanmar | 3.2 |
| 29 | 🇵🇰 Pakistan | 2.4 |
| 30 | 🇷🇺 Russia | 0 |
Due to the structure of the STI, economies can only perform well if they score highly in all three pillars. This mirrors the reality of sustainability, where balancing economic, social, and environmental priorities is critical.
Ready to Learn More?
This infographic was just a preview of what the Sustainable Trade Index has to offer. To learn more, visit the STI landing page, where you can download additional resources such as the executive summary.
This visual-first report was produced in partnership with Visual Capitalist. It includes comprehensive results at the individual pillar level, as well as spotlights on top performing economies.

-

 Markets4 days ago
Ranked: The Largest U.S. Corporations by Number of Employees
We visualized the top U.S. companies by employees, revealing the massive scale of retailers like Walmart, Target, and Home Depot.
-

 Economy1 week ago
Where U.S. Inflation Hit the Hardest in March 2024
We visualized product categories that saw the highest % increase in price due to U.S. inflation as of March 2024.
-

 Economy3 weeks ago
G20 Inflation Rates: Feb 2024 vs COVID Peak
We visualize inflation rates across G20 countries as of Feb 2024, in the context of their COVID-19 pandemic peak.
-

 Economy4 weeks ago
Mapped: Unemployment Claims by State
This visual heatmap of unemployment claims by state highlights New York, California, and Alaska leading the country by a wide margin.
-

 Markets1 month ago
Confidence in the Global Economy, by Country
Will the global economy be stronger in 2024 than in 2023?
-

 Maps1 month ago
Mapped: Breaking Down the $3 Trillion African Economy by Country
The top three economic powerhouses of Africa contribute more than one-third to the African economy. We rank the nations of the world’s second-largest continent by 2024…


