From complete overhauls to more subtle tweaks, these tech logos have had quite a journey. Featuring: Google, Apple, and more.


The highest one-year return among the top S&P 500 stocks from 1980 to 2022 was a staggering 2,620%. Which stocks top the ranks?


Empty office space is hitting record highs in 2023. We show almost 1 billion square feet of unused space stacked as a single office tower.


From Patagonia to TikTok, which brands are highly regarded in the eyes of Americans? This visual ranks the brand reputations of 100 companies.


In this visual we showcase the relative size of the 100 largest U.S. banks in terms of consolidated assets.


S&P 500 companies make up $34 trillion in market value combined. This graphic shows how they break down by weight and sector.
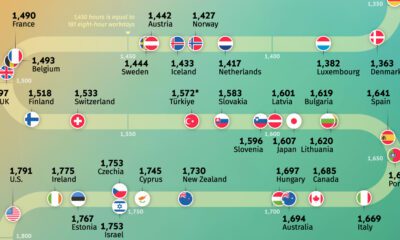

Where do people work the most? Explore our analysis of the average annual working hours across OECD countries.


There's more to consider than the price tag when purchasing a house. This ranking reveals the most affordable U.S. cities for home buyers.


Which companies prioritize innovation the most? This infographic highlights BCG's 2023 Most Innovative Companies ranking.
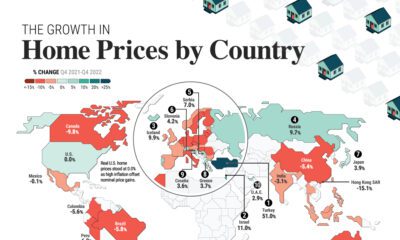

Global house prices were resilient in 2022, rising 6%. We compare nominal and real price growth by country as interest rates surged.
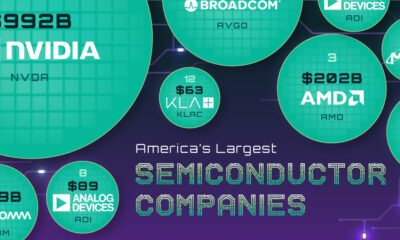

This graphic visualizes the market capitalizations of America's 15 largest semiconductor companies.


