
From complete overhauls to more subtle tweaks, these tech logos have had quite a journey. Featuring: Google, Apple, and more.
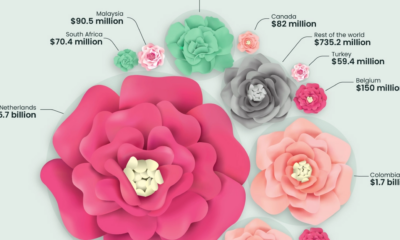

This graphic highlights global flower bouquet sales in 2021 and how a few countries dominate the entire flower export market.
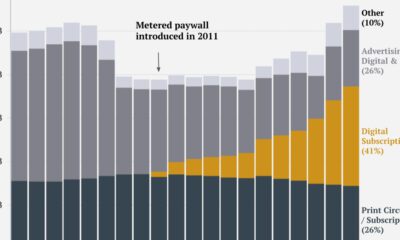

This graphic tracks the New York Times’ revenue streams over the past two decades, identifying its transition from advertising to subscription-reliant.


This infographic ranks the 10 most valuable bank brands over the past five years (Spoiler: U.S. banks aren't in the top four)
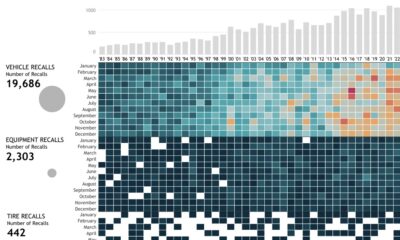

This interactive graphic visualizes U.S. automobile recalls over the past 40 years by type, company, components, and the number of people impacted.


From New York to Damascus, this infographic uses EIU cost of living data to rank the world's most and least expensive cities to live in
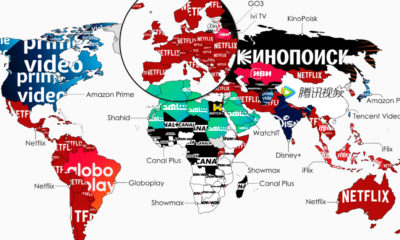

What is the top streaming service in each country? This map highlights the streaming services with the highest subscribers in 134 countries.


In this visualization, we rank the top 50 websites that receive the most internet traffic, from Google to CNN.
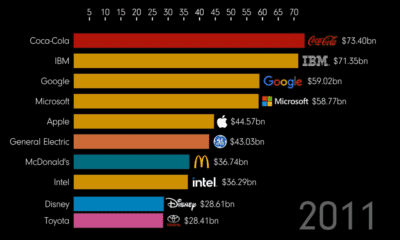

How much money is in a brand? And which brands have risen and fallen? This animation tracks the most valuable brands over 20+ years
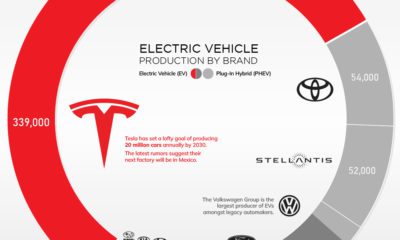

Tesla is still the dominant player in electric vehicles. However, it may not be long until the rest of the industry catches up.
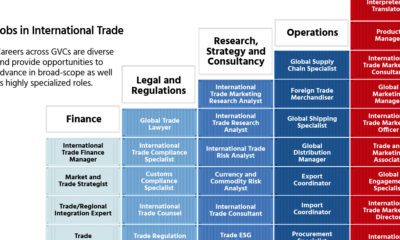

Global trade is growing across regions and countries which is creating an explosion in new jobs and education opportunities.


 Creator Program