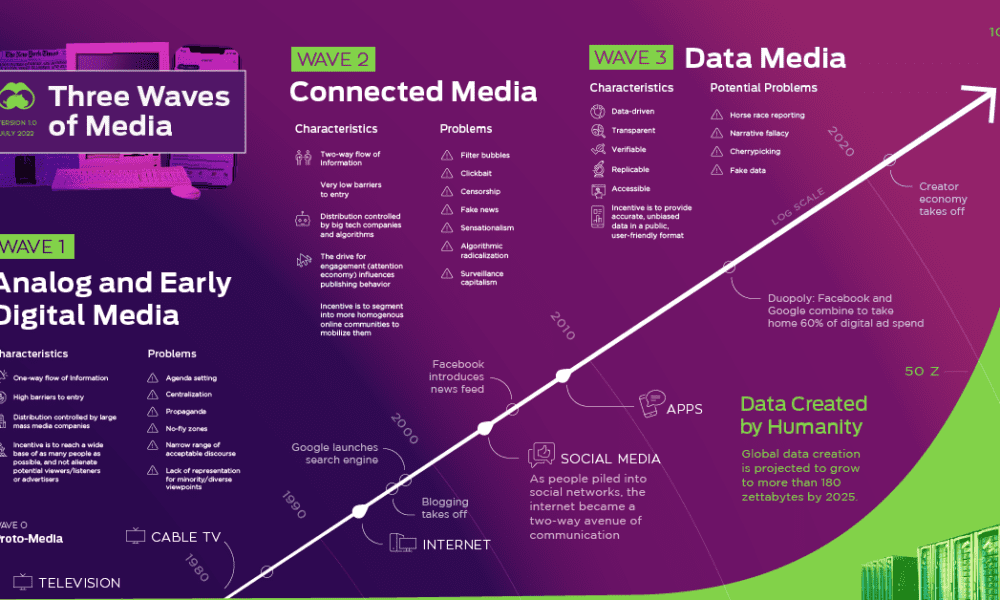
Media and information delivery is transforming at an increasing pace. Here's why the future will be more data-driven, transparent, and...
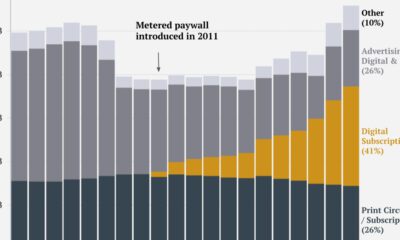

This graphic tracks the New York Times’ revenue streams over the past two decades, identifying its transition from advertising to subscription-reliant.
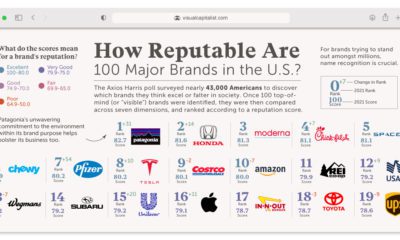

What comes to mind when you think of a good or bad brand? This poll ranks the brand reputation of 100 major companies in America.


This infographic examines trends in each generation's media consumption to see how Americans adapted during the pandemic.
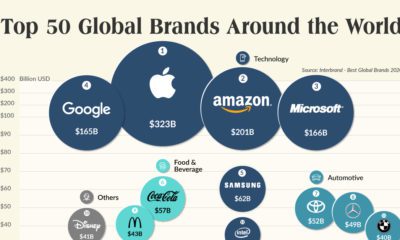

This graphic showcases 2020's top 50 most valuable global brands and explores how COVID-19 has triggered a brand shift with huge implications.


This graphic compares consumers’ most loved brands before the COVID-19 pandemic to their most loved brands during the pandemic.
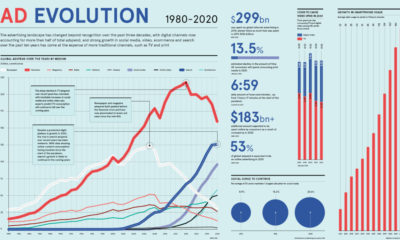

How has global advertising spending shifted over recent decades? We look at the data to see how both the industry and media have evolved.
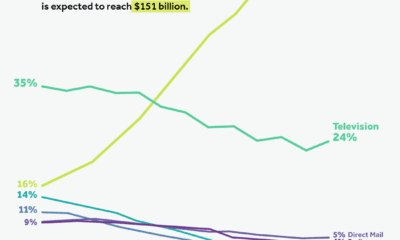

Internet advertising has shown steady growth in the last decade. By 2024, it’s projected to capture 60% of total ad spend in the United States.
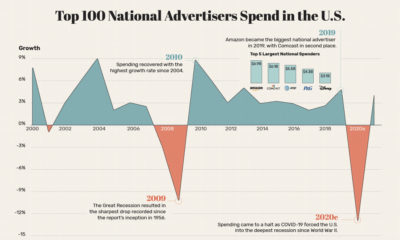

This graphic visualizes the fluctuations in advertising spend in the U.S., along with its brutal decline of 13% as a result of COVID-19.
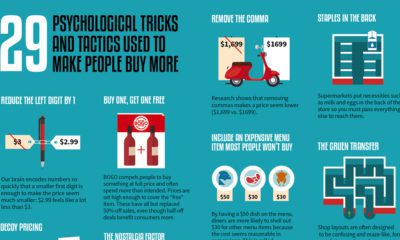

This graphic looks at 29 different psychological tricks that marketers use to try and influence consumer behavior.


 Creator Program