Energy
Mapped: Biggest Sources of Electricity by State and Province
![]() Subscribe to the Elements free mailing list for more like this
Subscribe to the Elements free mailing list for more like this


This was originally posted on Elements. Sign up to the free mailing list to get beautiful visualizations on natural resource megatrends in your email every week.
Mapped: Biggest Sources of Electricity by State and Province
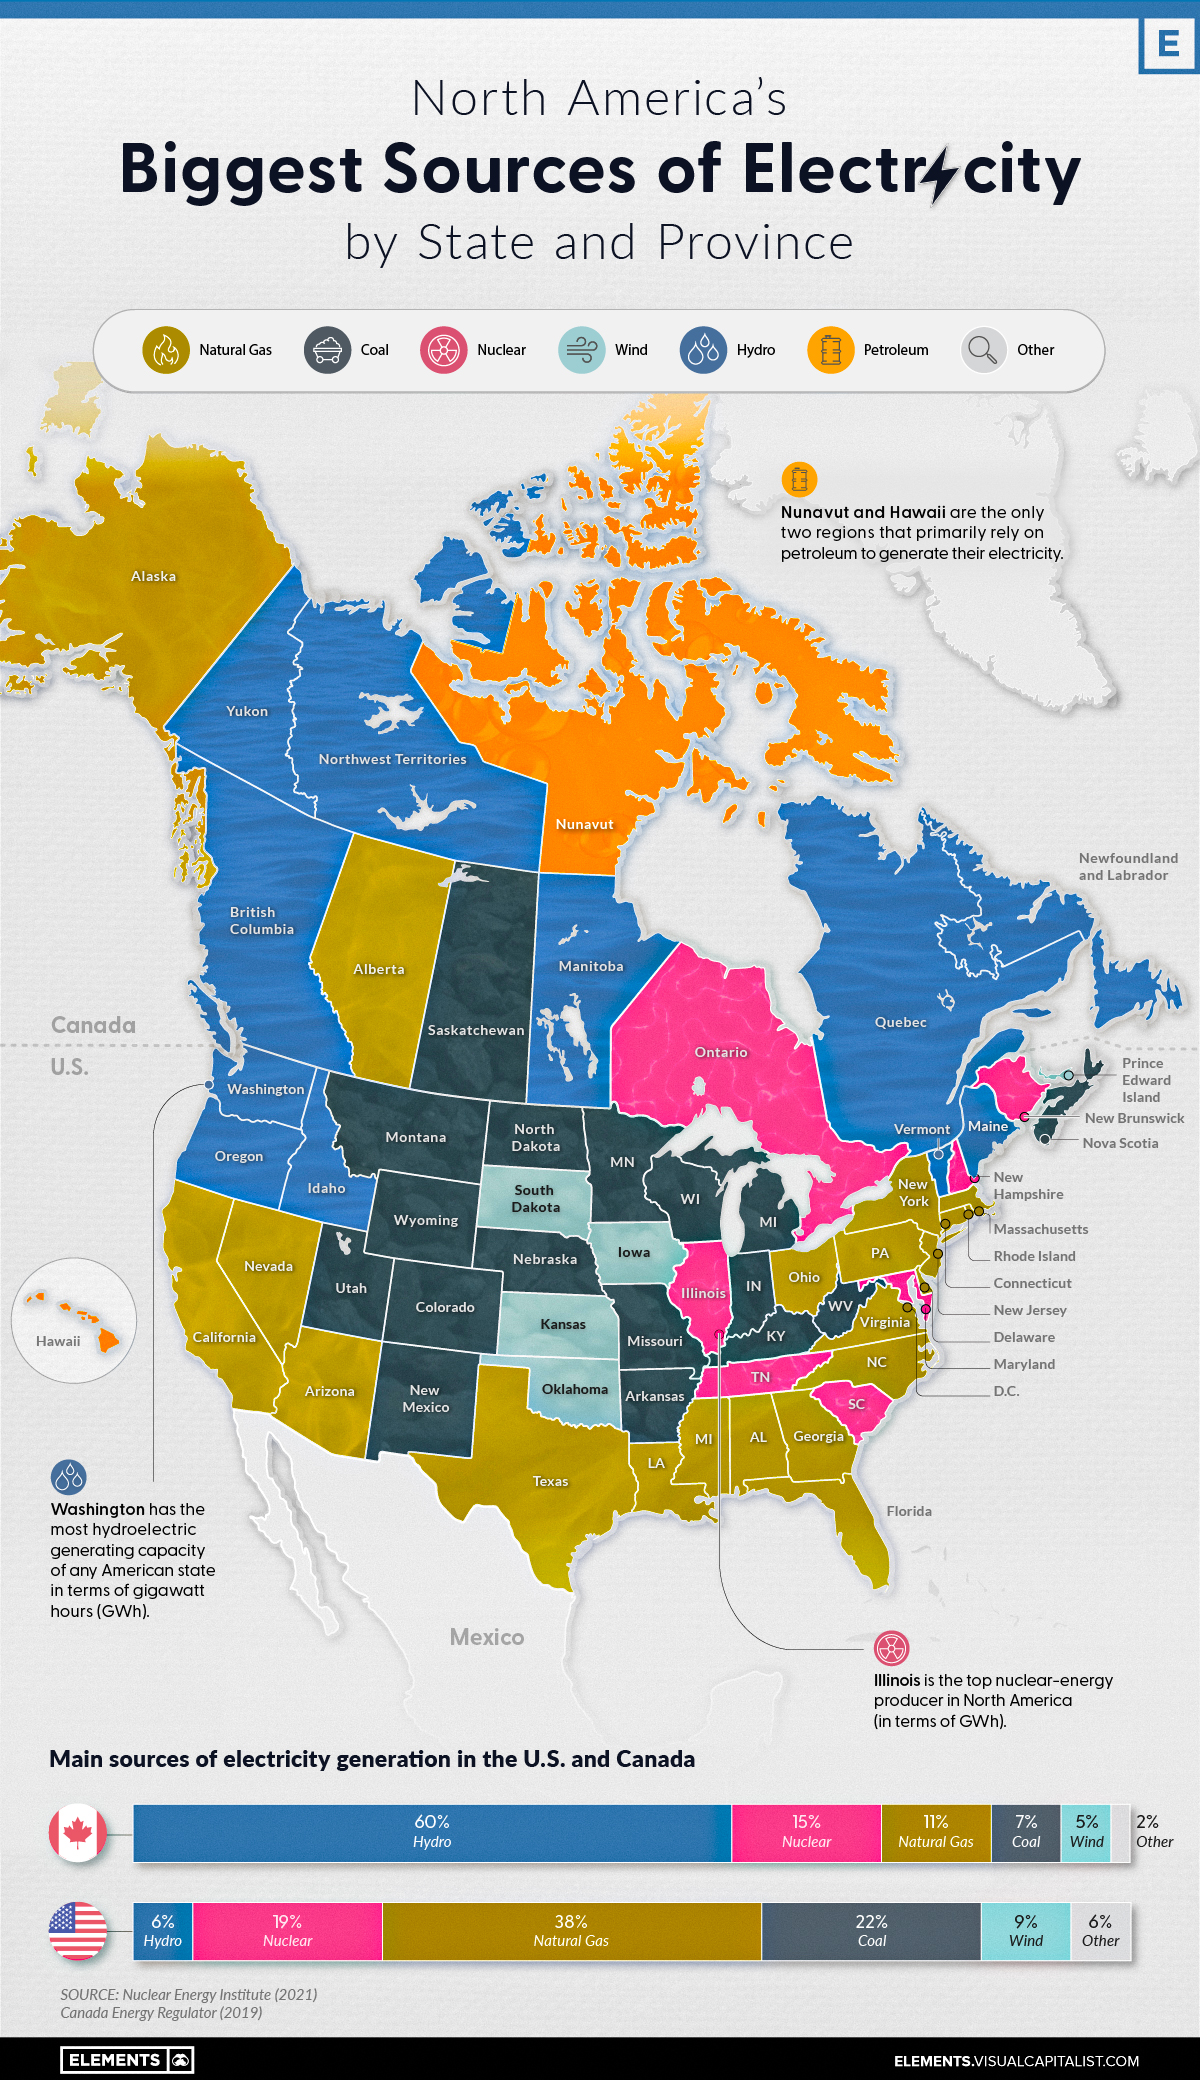
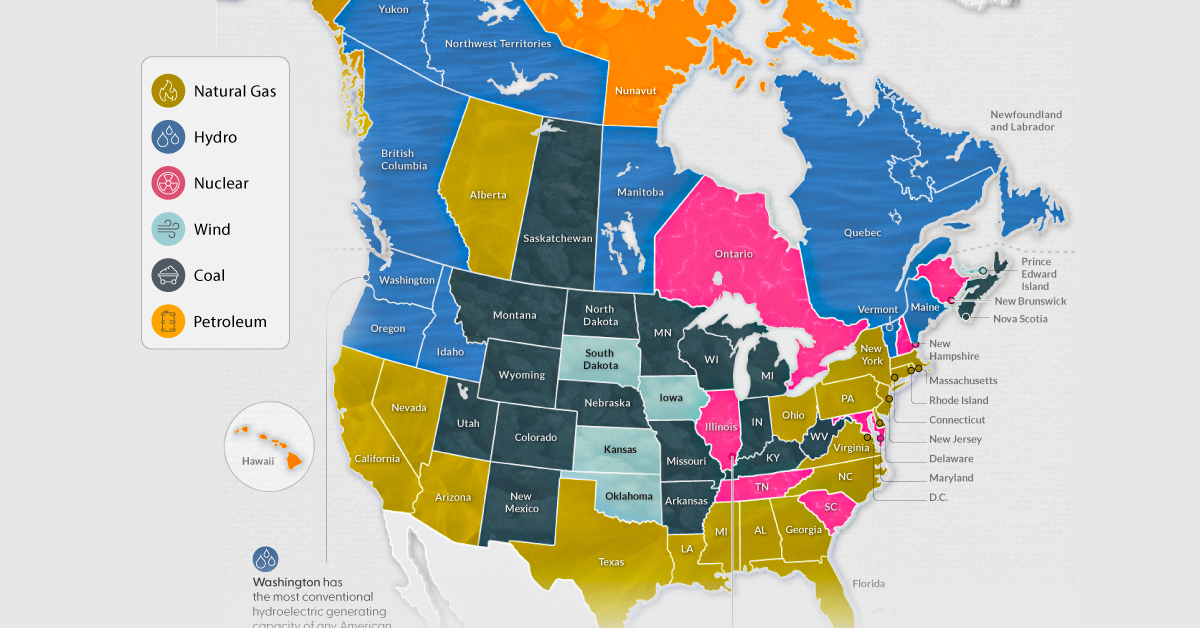
On a national scale, the United States and Canada rely on a very different makeup of sources to generate their electricity.
The U.S. primarily uses natural gas, coal, and nuclear power, while Canada relies on both hydro and nuclear. That said, when zooming in on the province or state level, individual primary electricity sources can differ greatly.
Here’s a look at the electricity generation in the states and provinces of these two countries using data from the Nuclear Energy Institute (2021) and the Canada Energy Regulator (2019).
Natural Gas
Natural gas is widely used for electricity generation in the United States. Known as a “cleaner” fossil fuel, its abundance, coupled with an established national distribution network and relatively low cost, makes it the leading electricity source in the country.
In 2021, 38% of the 4120 terawatt-hours (TWh) of electricity generated in the U.S. came from natural gas. Not surprisingly, more than 40% of American states have natural gas as their biggest electricity source.
Here are some states that have the largest shares of natural gas-sourced electricity.
| State/Province | % of Electricity from Natural Gas |
|---|---|
| 🇺🇸 Rhode Island | 90.9 |
| 🇺🇸 Delaware | 85.8 |
| 🇺🇸 Massachusetts | 76.9 |
| 🇺🇸 Florida | 73.9 |
| 🇺🇸 Mississippi | 72.1 |
In Canada, natural gas is only the third-biggest electricity source (behind hydro and nuclear), accounting for 11% of the 632 TWh of electricity produced in 2019. Alberta is the only province with natural gas as its main source of electricity.
Nuclear
Nuclear power is a carbon-free energy source that makes up a considerable share of the energy generated in both the U.S. and Canada.
19% of America’s and 15% of Canada’s electricity comes from nuclear power. While the percentages are close to one another, it’s good to note that the United States generates 6 to 7 times more electricity than Canada each year, yielding a lot more nuclear power than Canada in terms of gigawatt hours (GWh) per year.
As seen in the map, many states and provinces with nuclear as their main source of electricity are concentrated in the eastern half of the two countries.
In the U.S., Illinois, Pennsylvania, and South Carolina are top producers in terms of GWh/year. Illinois and South Carolina also have nuclear as their primary electricity source, whereas Pennsylvania’s electricity production from natural gas exceeds that from nuclear.
The vast majority of Canada’s nuclear reactors (18 of 19) are in Ontario, with the 19th in New Brunswick. Both of these provinces rely on nuclear as their biggest source of electricity.
Renewables: Hydro, Wind and Solar
Out of the different types of renewable electricity sources, hydro is the most prevalent in North America. For example, 60% of Canada’s and 6% of the U.S.’s electricity comes from hydropower.
Here are the states and provinces that have hydro as their biggest source of electricity.
| State/Province | % of Electricity from Hydro |
|---|---|
| 🇨🇦 Manitoba | 97 |
| 🇨🇦 Newfoundland and Labrador | 95 |
| 🇨🇦 Quebec | 94 |
| 🇨🇦 British Columbia | 87 |
| 🇨🇦 Yukon | 80 |
| 🇺🇸 Washington | 65 |
| 🇺🇸 Idaho | 51 |
| 🇺🇸 Vermont | 50 |
| 🇨🇦 Northwest Territories | 47 |
| 🇺🇸 Oregon | 46 |
Wind and solar power collectively comprise a small percentage of total electricity generated in both countries. While no state or province relies on solar as its biggest source of electricity, Iowa, Kansas, Oklahoma, and South Dakota rely primarily on wind for their electricity, along with Canada’s Prince Edward Island (PEI).
Coal and Oil
Coal and oil are emission-heavy electricity sources still prevalent in North America.
Currently, 22% of America’s and 7% of Canada’s electricity comes from coal, with places such as Kentucky, Missouri, West Virginia, Saskatchewan, and Nova Scotia still relying on coal as their biggest sources of electricity.
Certain regions also use petroleum to generate their electricity. Although its use for this purpose is declining, it is still the biggest source of electricity in both Hawaii and Nunavut.
Over the next few years, it will be interesting to observe the use of these fossil fuels for electricity generation in the U.S. and Canada. Despite the differences in climate commitments between the two countries, lowering coal and oil-related emissions may be a critical part of hitting decarbonization targets in a timely manner.


Energy
Mapped: The Age of Energy Projects in Interconnection Queues, by State
This map shows how many energy projects are in interconnection queues by state and how long these projects have been queued up, on average.


Age of Energy Projects in Interconnection Queues, by State
This was originally posted on our Voronoi app. Download the app for free on iOS or Android and discover incredible data-driven charts from a variety of trusted sources.
By the end of 2023, more than 11,000 energy projects were in interconnection queues in the United States, waiting for a green-light from regional grid operators to proceed with construction.
This map, created in partnership with the National Public Utilities Council, maps out the average age of active energy projects in interconnection queues by state, using data from Berkeley Lab.
Interconnection Queues, Explained
Interconnection queues are lists of energy projects that have made interconnection requests to their regional grid operators. Once submitted, these requests formally initiate the impact study process that each project goes through before grid connection, forming waiting lists for approval known as interconnection queues.
In recent years, both the number and generation capacity of queued projects have surged in the United States, along with the length of time spent in queue.
According to Berkeley Lab, the amount of generation capacity entering queues each year has risen by more than 550% from 2015 to 2023, with average queue duration rising from 3 years to 5 years the same period.
As a result of the growing backlog, a large proportion of projects ultimately withdraw from queues, leading to only 19% of applications reaching commercial operations.
The Backlog: Number of Projects and Average Wait Times
Of the 11,000 active projects in U.S. queues at the end of 2023, Texas, California, and Virginia had the most in queue; 1,208, 947, and 743, respectively.
When looking at the average ages of these projects, all three states hovered around the national average of 34 months (2.83 years), with Texas sporting 28 months, California 33, and Virginia 34.
Vermont, Minnesota, Wisconsin, and Florida, on the other hand, had the highest average queue durations; 54, 49, 47, and 46 months, respectively.
Average Queue Duration by Project Type
At the end of 2023, more than 95% of the generation capacity in active interconnection queues was for emission-free resources. The table below provides a breakdown.
| Project Type | Average Queue Duration (As of 12/31/2023) | Number of Projects in Queue |
|---|---|---|
| Wind | 40 months | 841 |
| Solar | 34 months | 4,506 |
| Wind+Battery | 34 months | 76 |
| Solar+Battery | 27 months | 2,377 |
| Battery | 24 months | 2,818 |
Wind projects had the highest wait times at the end of 2023 with an average age of 40 months (3.33 years). Solar projects, on the other hand, made up more than 40% of projects in queue.
Overall, reducing the time that these renewable energy projects spend in queues can accelerate the transition to a low-carbon energy future.
According to the U.S. Department of Energy, enhancing data transparency, streamlining approval processes, promoting economic efficiency, and maintaining a reliable grid are some of the ways this growing backlog can be mitigated.

-

 Wealth6 days ago
Charted: Which City Has the Most Billionaires in 2024?
-

 Mining2 weeks ago
Gold vs. S&P 500: Which Has Grown More Over Five Years?
-

 Uranium2 weeks ago
The World’s Biggest Nuclear Energy Producers
-

 Education2 weeks ago
How Hard Is It to Get Into an Ivy League School?
-

 Debt2 weeks ago
How Debt-to-GDP Ratios Have Changed Since 2000
-

 Sports2 weeks ago
The Highest Earning Athletes in Seven Professional Sports
-

 Science2 weeks ago
Visualizing the Average Lifespans of Mammals
-

 Brands1 week ago
How Tech Logos Have Evolved Over Time