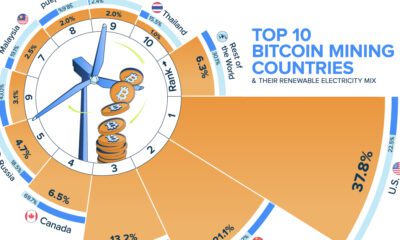

Bitcoin miners worldwide use about 348 TWh of electricity per year, as much as some countries, but just where does all that power come from?
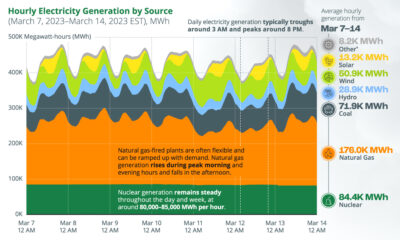

This chart tracks U.S. hourly electricity generation over one week, with various sources producing electricity at different times of the day.
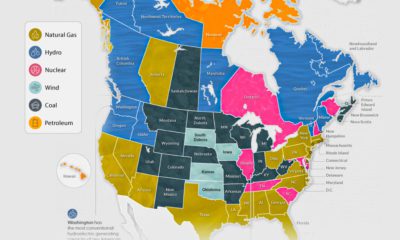

The U.S. and Canada rely on a different makeup of sources to generate their electricity. How does each state and province make theirs?
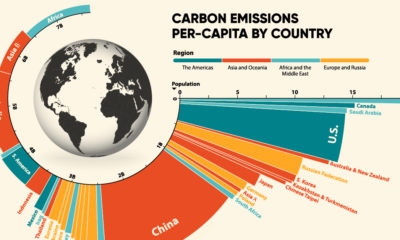

33.6 Gt of CO2 was emitted across the world in 2019. Here we visualize the global per capita CO2 emissions by country and region.
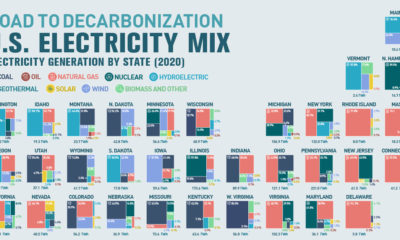

Can America become carbon-free by 2035? This graphic breaks down the United States’ electricity mix, by state.


