Technology
Animation: The Top 15 Global Brands (2000-2018)
Animation: The Top 15 Global Brands (2000-2018)
Time travel back to the early-2000s, and a list of the world’s most respected brands might be surprising.
Tobacco company Marlboro is still one of the top 15 global brands with a value of $22 billion, while companies like Nokia and AT&T also help to round out the group.
Aside from Microsoft, the tech companies at the time were mostly focused on hardware and services. HP was considered a top global brand at the time, and even IBM was still making PCs until the year 2005.
The Platform Revolution
How times have changed.
In today’s animation from TheRankings, you can see how the list of the top 15 global brands has evolved over the last two decades or so.
The visible shift: as soon as Google hits the rankings in 2008 (2:21 in video), it becomes clear that the money is on the software side – particularly in coding software that ends up as a dominant consumer platform.
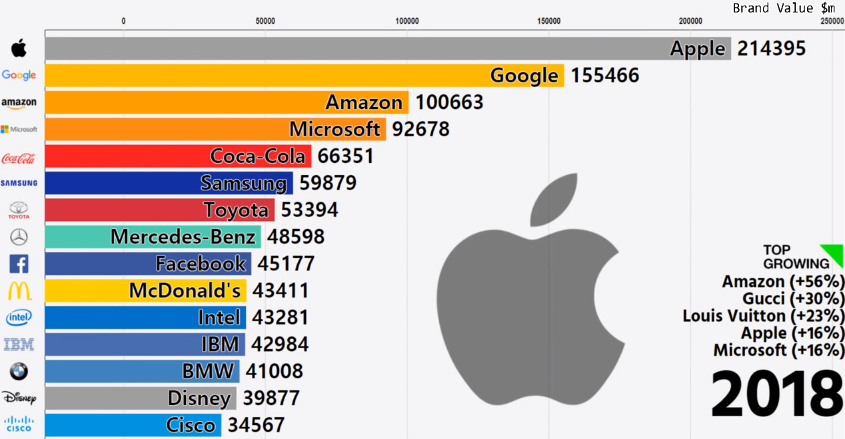
Shortly after, companies like Apple, Facebook, and Amazon enter the fold, quickly climbing to the top. Here are the final numbers for 2018 in terms of brand value, with data coming from Interbrand:
The Problem with Hardware
What’s the difference between the big hardware firms of old, and the successful ones that dot the list today?
From a business perspective, hardware companies need to have a bold and accurate vision of the future, constantly taking innovative strides to beat competitors to that vision. If they can only make incremental improvements, the reality is that their competitors can enter the fold to create cheaper, similar hardware.
Samsung, which finished 2018 as the world’s sixth most valued brand, is a good example of this in practice. The company has had the top-selling smartphone for every year between 2012-2018 – an impressive feat in staying on top of consumer trends and technology.
Despite Samsung’s success, it remains stuck behind four other tech brands on the list – all companies almost exclusively focused on platforms: Microsoft, Amazon, Google, and Apple.
Why are Platforms so Dominant?
Constant innovation is a good barrier to entry if you can keep doing it – but the platforms have an even more bulletproof strategy: being everywhere at once.
Facebook uses the powerful network effect from billions of people as a moat, and then it buys up-and-comers (Instagram, WhatsApp) to cover even more ground. As a result, competing with Facebook is a nightmare – even if you could theoretically acquire new users at $1 per user at a ridiculous scale, it would require a marketing investment of billions of dollars to make inroads on the company’s audience.
Microsoft owns various platforms (Windows, Xbox, LinkedIn, Azure, etc.) that help insulate from competition, while Google’s strategy is to be everywhere you need to search, even if it’s in your living room.
Because platforms have massive scale and are ubiquitous with consumers, it gives them the ultimate pricing power. In turn, at least so far, they have been able to establish the world’s most powerful consumer brands.


Technology
All of the Grants Given by the U.S. CHIPS Act
Intel, TSMC, and more have received billions in subsidies from the U.S. CHIPS Act in 2024.


All of the Grants Given by the U.S. CHIPS Act
This was originally posted on our Voronoi app. Download the app for free on iOS or Android and discover incredible data-driven charts from a variety of trusted sources.
This visualization shows which companies are receiving grants from the U.S. CHIPS Act, as of April 25, 2024. The CHIPS Act is a federal statute signed into law by President Joe Biden that authorizes $280 billion in new funding to boost domestic research and manufacturing of semiconductors.
The grant amounts visualized in this graphic are intended to accelerate the production of semiconductor fabrication plants (fabs) across the United States.
Data and Company Highlights
The figures we used to create this graphic were collected from a variety of public news sources. The Semiconductor Industry Association (SIA) also maintains a tracker for CHIPS Act recipients, though at the time of writing it does not have the latest details for Micron.
| Company | Federal Grant Amount | Anticipated Investment From Company |
|---|---|---|
| 🇺🇸 Intel | $8,500,000,000 | $100,000,000,000 |
| 🇹🇼 TSMC | $6,600,000,000 | $65,000,000,000 |
| 🇰🇷 Samsung | $6,400,000,000 | $45,000,000,000 |
| 🇺🇸 Micron | $6,100,000,000 | $50,000,000,000 |
| 🇺🇸 GlobalFoundries | $1,500,000,000 | $12,000,000,000 |
| 🇺🇸 Microchip | $162,000,000 | N/A |
| 🇬🇧 BAE Systems | $35,000,000 | N/A |
BAE Systems was not included in the graphic due to size limitations
Intel’s Massive Plans
Intel is receiving the largest share of the pie, with $8.5 billion in grants (plus an additional $11 billion in government loans). This grant accounts for 22% of the CHIPS Act’s total subsidies for chip production.
From Intel’s side, the company is expected to invest $100 billion to construct new fabs in Arizona and Ohio, while modernizing and/or expanding existing fabs in Oregon and New Mexico. Intel could also claim another $25 billion in credits through the U.S. Treasury Department’s Investment Tax Credit.
TSMC Expands its U.S. Presence
TSMC, the world’s largest semiconductor foundry company, is receiving a hefty $6.6 billion to construct a new chip plant with three fabs in Arizona. The Taiwanese chipmaker is expected to invest $65 billion into the project.
The plant’s first fab will be up and running in the first half of 2025, leveraging 4 nm (nanometer) technology. According to TrendForce, the other fabs will produce chips on more advanced 3 nm and 2 nm processes.
The Latest Grant Goes to Micron
Micron, the only U.S.-based manufacturer of memory chips, is set to receive $6.1 billion in grants to support its plans of investing $50 billion through 2030. This investment will be used to construct new fabs in Idaho and New York.

-

 Energy1 week ago
The World’s Biggest Nuclear Energy Producers
-

 Money2 weeks ago
Which States Have the Highest Minimum Wage in America?
-

 Technology2 weeks ago
Ranked: Semiconductor Companies by Industry Revenue Share
-

 Markets2 weeks ago
Ranked: The World’s Top Flight Routes, by Revenue
-

 Countries2 weeks ago
Population Projections: The World’s 6 Largest Countries in 2075
-

 Markets2 weeks ago
The Top 10 States by Real GDP Growth in 2023
-

 Demographics2 weeks ago
The Smallest Gender Wage Gaps in OECD Countries
-

 United States2 weeks ago
Where U.S. Inflation Hit the Hardest in March 2024