

This graphic analyzes social platform usage among U.S. teenagers (13-17 years old), using data from a recent Pew Research study.


The video games industry could generate over $300 billion by 2026. Here is a break down of that revenue by source.
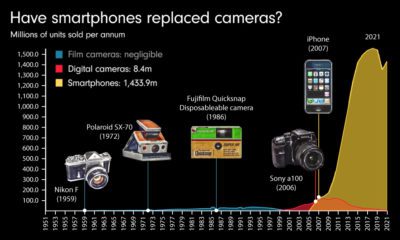

Have smartphones fully replaced cameras? This video charts 70 years of camera sales and how smartphones have affected the market.
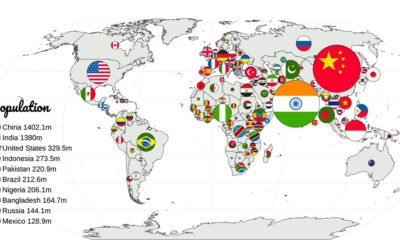

Which countries have the largest populations, or the highest GDP? This animation compares countries based on 20 different metrics.


This epic attempt to condense the history of the world — including the rise and fall of empires — fits into a single video.
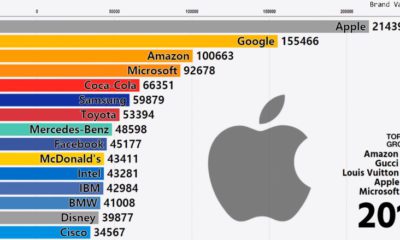

This stunning animation shows a dramatic change in the world's most valuable global brands. Watch tech companies like Apple shoot up the rankings in style.

Visual Capitalist's creative team highlights the motion graphics, data visualizations, and infographics that have inspired them.

How did Donald Trump get to be worth billions? See the details of his successes and failures, his family's surprising past, and the help he got...

Today, credit cards are a key source of profits for big banks. But, it wasn't always this way - the history of credit cards shows things...
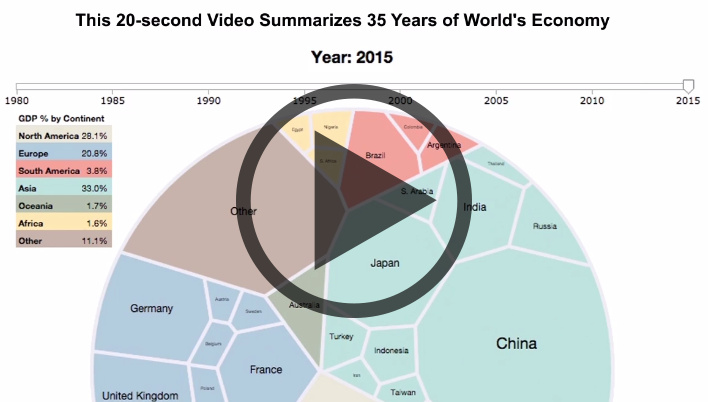
Watch the world economy evolve over 35 years in this video, which captures the breakdown of economic output by country.