Technology
Animation: Human Population Growth Over All of History
Imagine that for every million people on Earth, there was a single dot on a map.
In total, that would be about 7,600 dots – representing today’s global population of 7.6 billion.
But, what if we went back in time, and watched those dots accumulate over human history? When and where do the first dots appear, and when does population growth ramp up to get to the billions of people that are alive today?
The History of Population Growth
Today’s animation comes from the American Museum of Natural History, and it shows over 200,000 years of population growth and the major events along the way.
If you consider yourself on the more impatient side of things, we suggest starting at 1:50 which will zoom you to 400 AD – the time of India’s Golden Age. Alternatively, go to 3:25 to witness the Bubonic Plague’s rare negative impact on population growth, as well as the ensuing age of European exploration.
It took 200,000 years of human history to get to one billion people – and just 200 years to reach seven billion.
That’s partly how the exponential “hockey stick” growth curve works, but it is also a factor of improvements in living standards, sanitation, and medicine that came after the Industrial Revolution.
Key Population Moments
Here are a few moments that stood out to us in the video, that we think represent particularly interesting moments in human population history:
Agriculture
The impact of farming cannot be emphasized enough. For many thousands of years, the human population dwindled until we learned how to plant crops to provide a scalable and sustainable food supply for a hungry population.
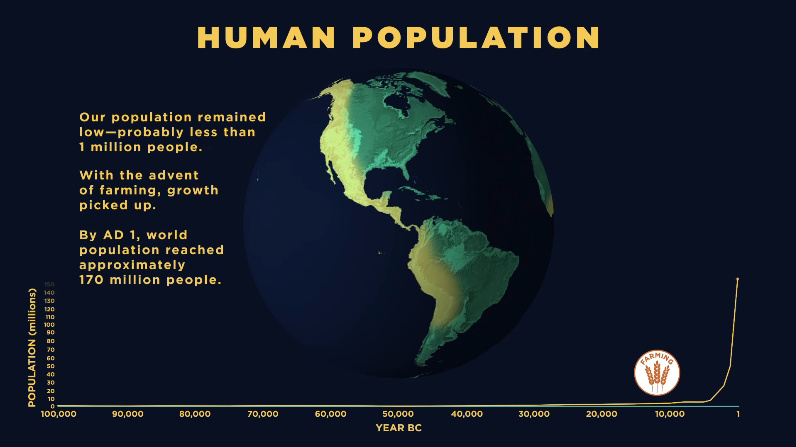
As you can see, after agriculture starts spreading, the human population quickly skyrockets. It is estimated to have reached roughly 170 million by the year 1 AD.
East vs. West
The Greeks and Romans were interesting cultures to us in many ways – but one thing that is sometimes missed with a Western education is the sheer size of Indian and Chinese civilizations.
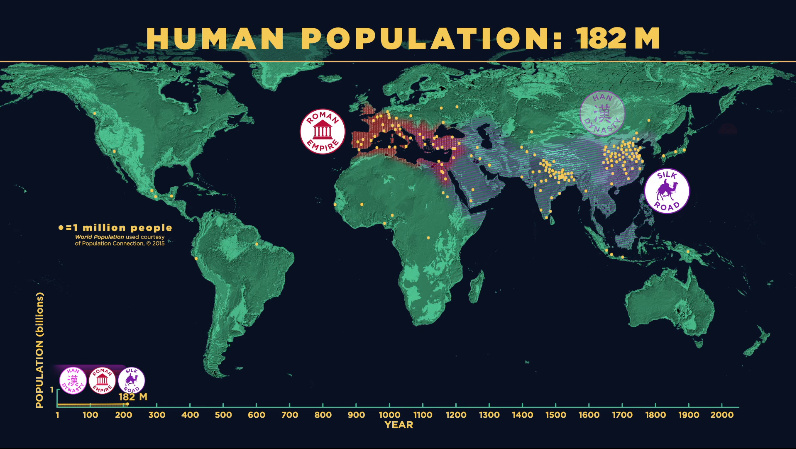
The above screenshot is from close to the territorial peak of the Roman Empire – notice its size in comparison to the Han Dynasty in China, as well as the area that is modern-day India.
Bubonic Plague
The Black Death, which started in 1347, didn’t do much to increase Europe’s population.
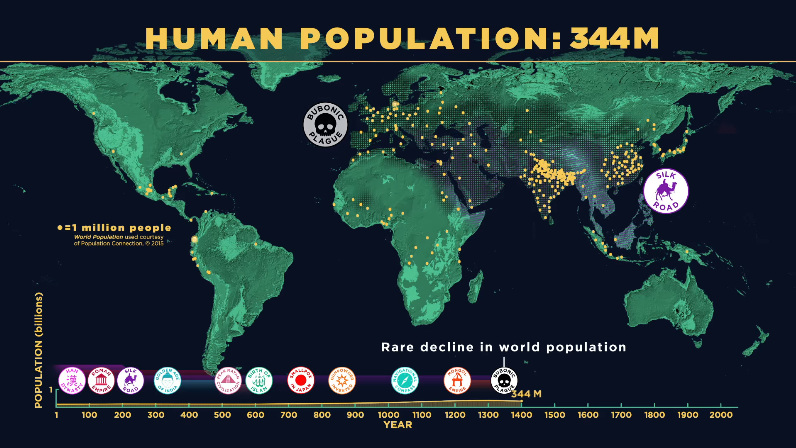
In fact, this was one of the rare times that global human population growth went backwards for multiple decades.
Post-Industrial Revolution
The Industrial Revolution brought innovations to food and medicine, and kickstarted an era that would be usher in the birth of many new technologies.
This screenshot is from close to 1900, when these innovations started to make rapid global population growth a reality.
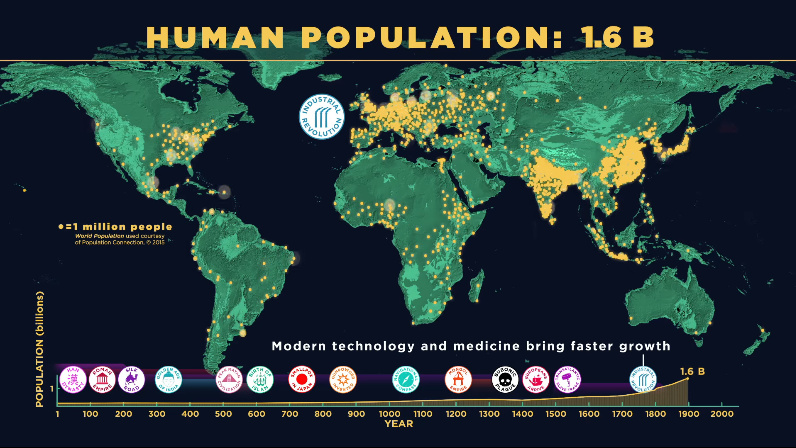
Over the next century, the population would more than quadruple to today’s seven billion plus people.
The Future of Population Growth
Naturally, this leads to thinking about the future of the human population.
For that, we recommend visiting these two prior animations: The 20 Most Populous Megacities in 2100 and The World’s Population by Region in 2100.


Technology
Countries With the Highest Rates of Crypto Ownership
While the U.S. is a major market for cryptocurrencies, two countries surpass it in terms of their rates of crypto ownership.


Countries With the Highest Rates of Crypto Ownership
This was originally posted on our Voronoi app. Download the app for free on iOS or Android and discover incredible data-driven charts from a variety of trusted sources.
This graphic ranks the top 10 countries by their rate of cryptocurrency ownership, which is the percentage of the population that owns crypto. These figures come from crypto payment gateway, Triple-A, and are as of 2023.
Data and Highlights
The table below lists the rates of crypto ownership in the top 10 countries, as well as the number of people this amounts to.
| Country | % of Population Who Own Crypto | # of Crypto Owners |
|---|---|---|
| 🇦🇪 United Arab Emirates | 30.4 | 3M |
| 🇻🇳 Vietnam | 21.2 | 21M |
| 🇺🇸 U.S. | 15.6 | 53M |
| 🇮🇷 Iran | 13.5 | 12M |
| 🇵🇭 Philippines | 13.4 | 16M |
| 🇧🇷 Brazil | 12 | 26M |
| 🇸🇦 Saudi Arabia | 11.4 | 4M |
| 🇸🇬 Singapore | 11.1 | 665K |
| 🇺🇦 Ukraine | 10.6 | 4M |
| 🇻🇪 Venezuela | 10.3 | 3M |
Note that if we were to rank countries based on their actual number of crypto owners, India would rank first at 93 million people, China would rank second at 59 million people, and the U.S. would rank third at 52 million people.
The UAE Takes the Top Spot
The United Arab Emirates (UAE) boasts the highest rates of crypto ownership globally. The country’s government is considered to be very crypto friendly, as described in Henley & Partners’ Crypto Wealth Report 2023:
In the UAE, the Financial Services Regulatory Authority (FSRA-ADGM) was the first to provide rules and regulations regarding cryptocurrency purchasing and selling. The Emirates are generally very open to new technologies and have proposed zero taxes for crypto owners and businesses.
Vietnam leads Southeast Asia
According to the Crypto Council for Innovation, cryptocurrency holdings in Vietnam are also untaxed, making them an attractive asset.
Another reason for Vietnam’s high rates of ownership could be its large unbanked population (people without access to financial services). Cryptocurrencies may provide an alternative means of accessing these services without relying on traditional banks.
Learn More About Crypto From Visual Capitalist
If you enjoyed this post, be sure to check out The World’s Largest Corporate Holders of Bitcoin, which ranks the top 12 publicly traded companies by their Bitcoin holdings.

-

 Markets6 days ago
The World’s Fastest Growing Emerging Markets (2024-2029 Forecast)
-

 Technology2 weeks ago
All of the Grants Given by the U.S. CHIPS Act
-

 Green2 weeks ago
The Carbon Footprint of Major Travel Methods
-

 United States2 weeks ago
Visualizing the Most Common Pets in the U.S.
-

 Culture2 weeks ago
The World’s Top Media Franchises by All-Time Revenue
-

 Visual Capitalist1 week ago
Best Visualizations of April on the Voronoi App
-

 Wealth1 week ago
Charted: Which Country Has the Most Billionaires in 2024?
-

 Markets1 week ago
The Top Private Equity Firms by Country