Personal Finance
Visualizing American Income Levels by Age Group
Visualizing American Income Levels by Age Group
There are two commonly held beliefs around income and age:
1) Earning trajectory is largely determined by the time a person is 35-years-old
2) Income is positively correlated with age
How do these beliefs stand up to the actual income data? As it turns out, quite well.
Today’s data, from the IPUMS.org Current Population Survey, is a detailed look at income by age group.
The $50K Threshold
In the age of LinkedIn bragging it’s no surprise that two-thirds of people who are being paid the market rate believe they’re actually underpaid.
For people just starting out in the workforce, there can be a lot of pressure to earn a higher salary, but as the data shows, only a tiny percentage of workers under the age of 25 surpass a salary of $50K.
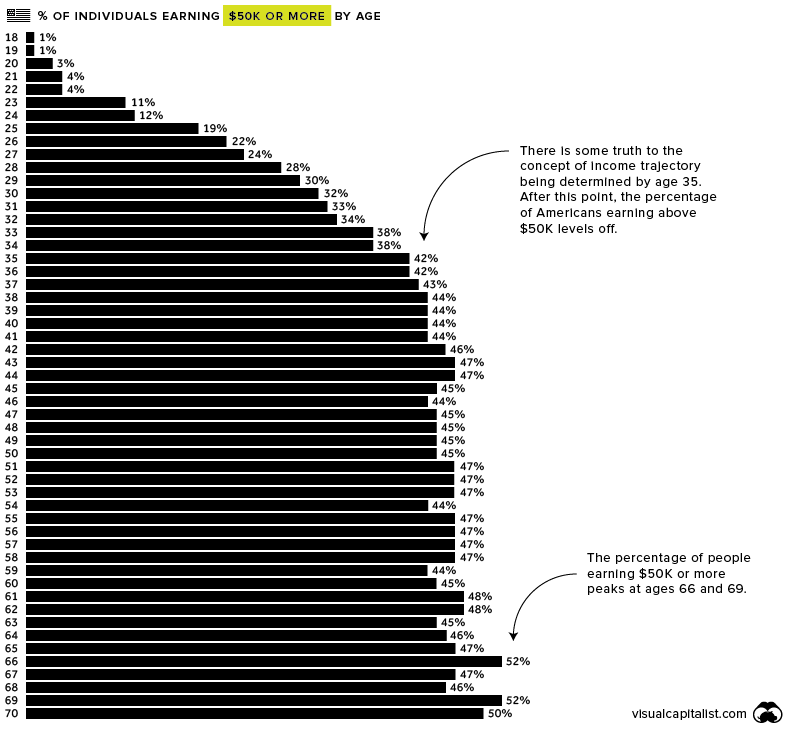
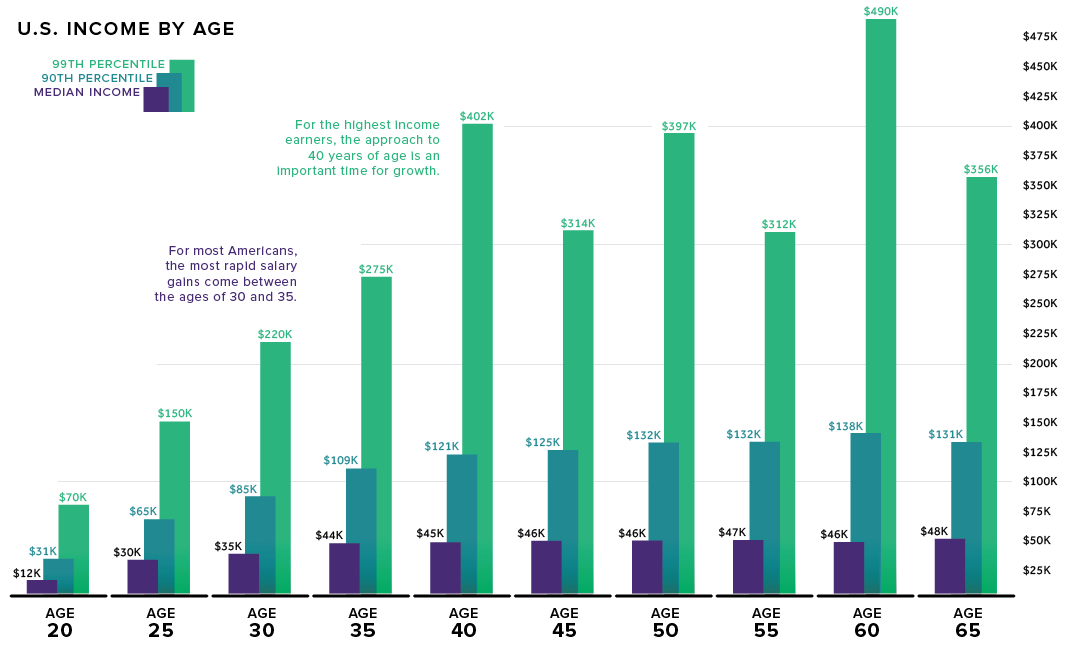
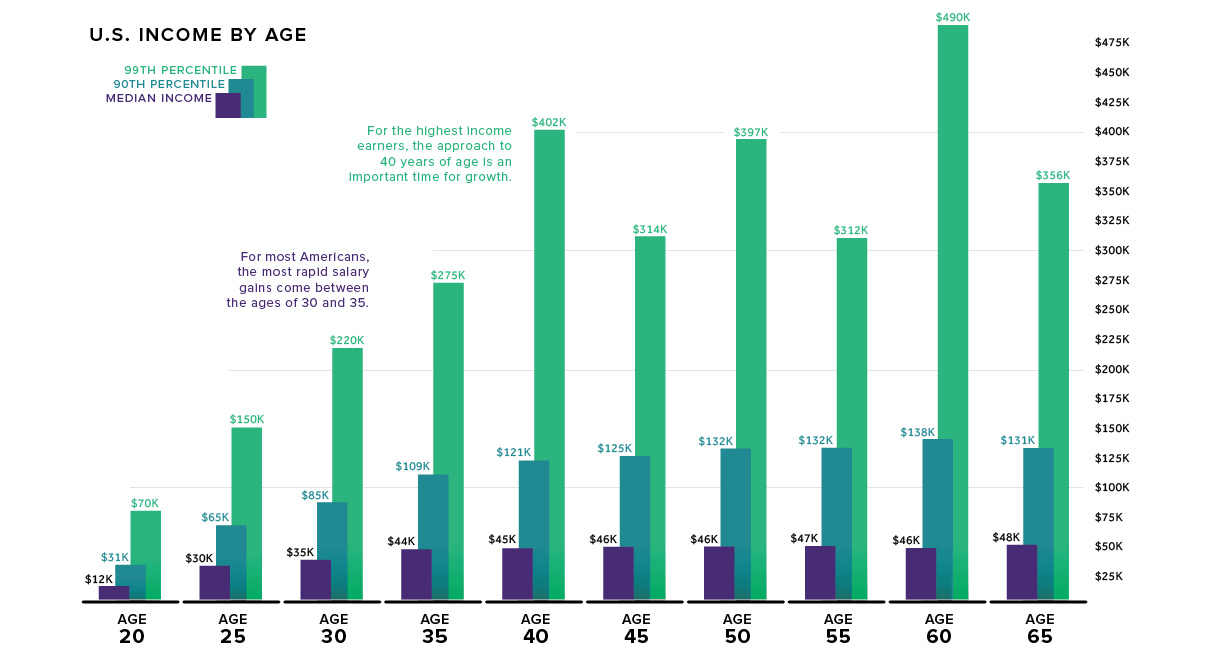
The majority of people in the work force make their greatest income strides between the ages of 30 and 35, with median income jumping by 26% during that short time-frame.
After the age of 35, the percentage of people earning $50K or more is surprisingly consistent until retirement age, hovering between 42% and 48%.
The $100K Threshold
Making $100K per year won’t put you in the top 1% – you’ll need to earn $300K to join that club – however, it’s still enough to live comfortably in most places in America.
Approximately 21 million people in the U.S. workforce earn over $100K. Here’s how they break down by age.
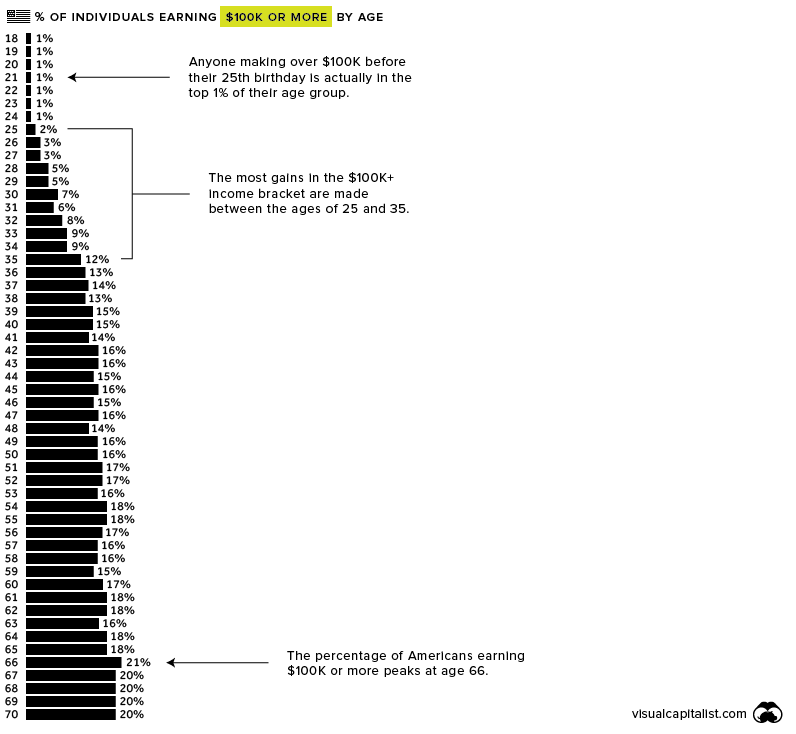
Interestingly, the percentage of Americans earning $100K or more jumps from 2% to 12%, and moves very little after that. Put another way, it’s rare for anyone in their 20s to earn over $100K, but many people who hit that threshold do so by the time they turn 40.
Much like those earning $50K or more, the percentage of $100K+ earners stays fairly consistent until retirement, peaking at age 66.
Individual salary situations will vary widely, of course, but it’s interesting to zoom out at the big picture of income in America.


Personal Finance
Chart: The Declining Value of the U.S. Federal Minimum Wage
This graphic compares the nominal vs. inflation-adjusted value of the U.S. minimum wage, from 1940 to 2023.


The Declining Value of the U.S. Federal Minimum Wage
This was originally posted on our Voronoi app. Download the app for free on iOS or Android and discover incredible data-driven charts from a variety of trusted sources.
This graphic illustrates the history of the U.S. federal minimum wage using data compiled by Statista, in both nominal and real (inflation-adjusted) terms. The federal minimum wage was raised to $7.25 per hour in July 2009, where it has remained ever since.
Nominal vs. Real Value
The data we used to create this graphic can be found in the table below.
| Year | Nominal value ($/hour) | Real value ($/hour) |
|---|---|---|
| 1940 | 0.3 | 6.5 |
| 1945 | 0.4 | 6.82 |
| 1950 | 0.75 | 9.64 |
| 1955 | 0.75 | 8.52 |
| 1960 | 1 | 10.28 |
| 1965 | 1.25 | 12.08 |
| 1970 | 1.6 | 12.61 |
| 1975 | 2.1 | 12.04 |
| 1980 | 3.1 | 11.61 |
| 1985 | 3.35 | 9.51 |
| 1990 | 3.8 | 8.94 |
| 1995 | 4.25 | 8.49 |
| 2000 | 5.15 | 9.12 |
| 2005 | 5.15 | 8.03 |
| 2010 | 7.25 | 10.09 |
| 2015 | 7.25 | 9.3 |
| 2018 | 7.25 | 8.78 |
| 2019 | 7.25 | 8.61 |
| 2020 | 7.25 | 8.58 |
| 2021 | 7.25 | 8.24 |
| 2022 | 7.25 | 7.61 |
| 2023 | 7.25 | 7.25 |
What our graphic shows is how inflation has eroded the real value of the U.S. minimum wage over time, despite nominal increases.
For instance, consider the year 1960, when the federal minimum wage was $1 per hour. After accounting for inflation, this would be worth around $10.28 today!
The two lines converge at 2023 because the nominal and real value are identical in present day terms.
Many States Have Their Own Minimum Wage
According to the National Conference of State Legislatures (NCSL), 30 states and Washington, D.C. have implemented a minimum wage that is higher than $7.25.
The following states have adopted the federal minimum: Georgia, Idaho, Indiana, Iowa, Kansas, Kentucky, New Hampshire, North Carolina, North Dakota, Oklahoma, Pennsylvania, Texas, Utah, Wisconsin, and Wyoming.
Meanwhile, the states of Alabama, Louisiana, Mississippi, South Carolina, and Tennessee have no wage minimums, but have to follow the federal minimum.
How Does the U.S. Minimum Wage Rank Globally?
If you found this topic interesting, check out Mapped: Minimum Wage Around the World to see which countries have the highest minimum wage in monthly terms, as of January 2023.

-

 Mining1 week ago
Gold vs. S&P 500: Which Has Grown More Over Five Years?
-

 Markets2 weeks ago
Ranked: The Most Valuable Housing Markets in America
-

 Money2 weeks ago
Which States Have the Highest Minimum Wage in America?
-

 AI2 weeks ago
Ranked: Semiconductor Companies by Industry Revenue Share
-

 Markets2 weeks ago
Ranked: The World’s Top Flight Routes, by Revenue
-

 Countries2 weeks ago
Population Projections: The World’s 6 Largest Countries in 2075
-

 Markets2 weeks ago
The Top 10 States by Real GDP Growth in 2023
-

 Demographics2 weeks ago
The Smallest Gender Wage Gaps in OECD Countries