Markets
$69 Trillion of World Debt in One Infographic
Get this infographic as a poster (and save 15% by being a VC+ member)


$69 Trillion of World Debt in One Infographic
Two decades ago, total government debt was estimated to sit at $20 trillion.
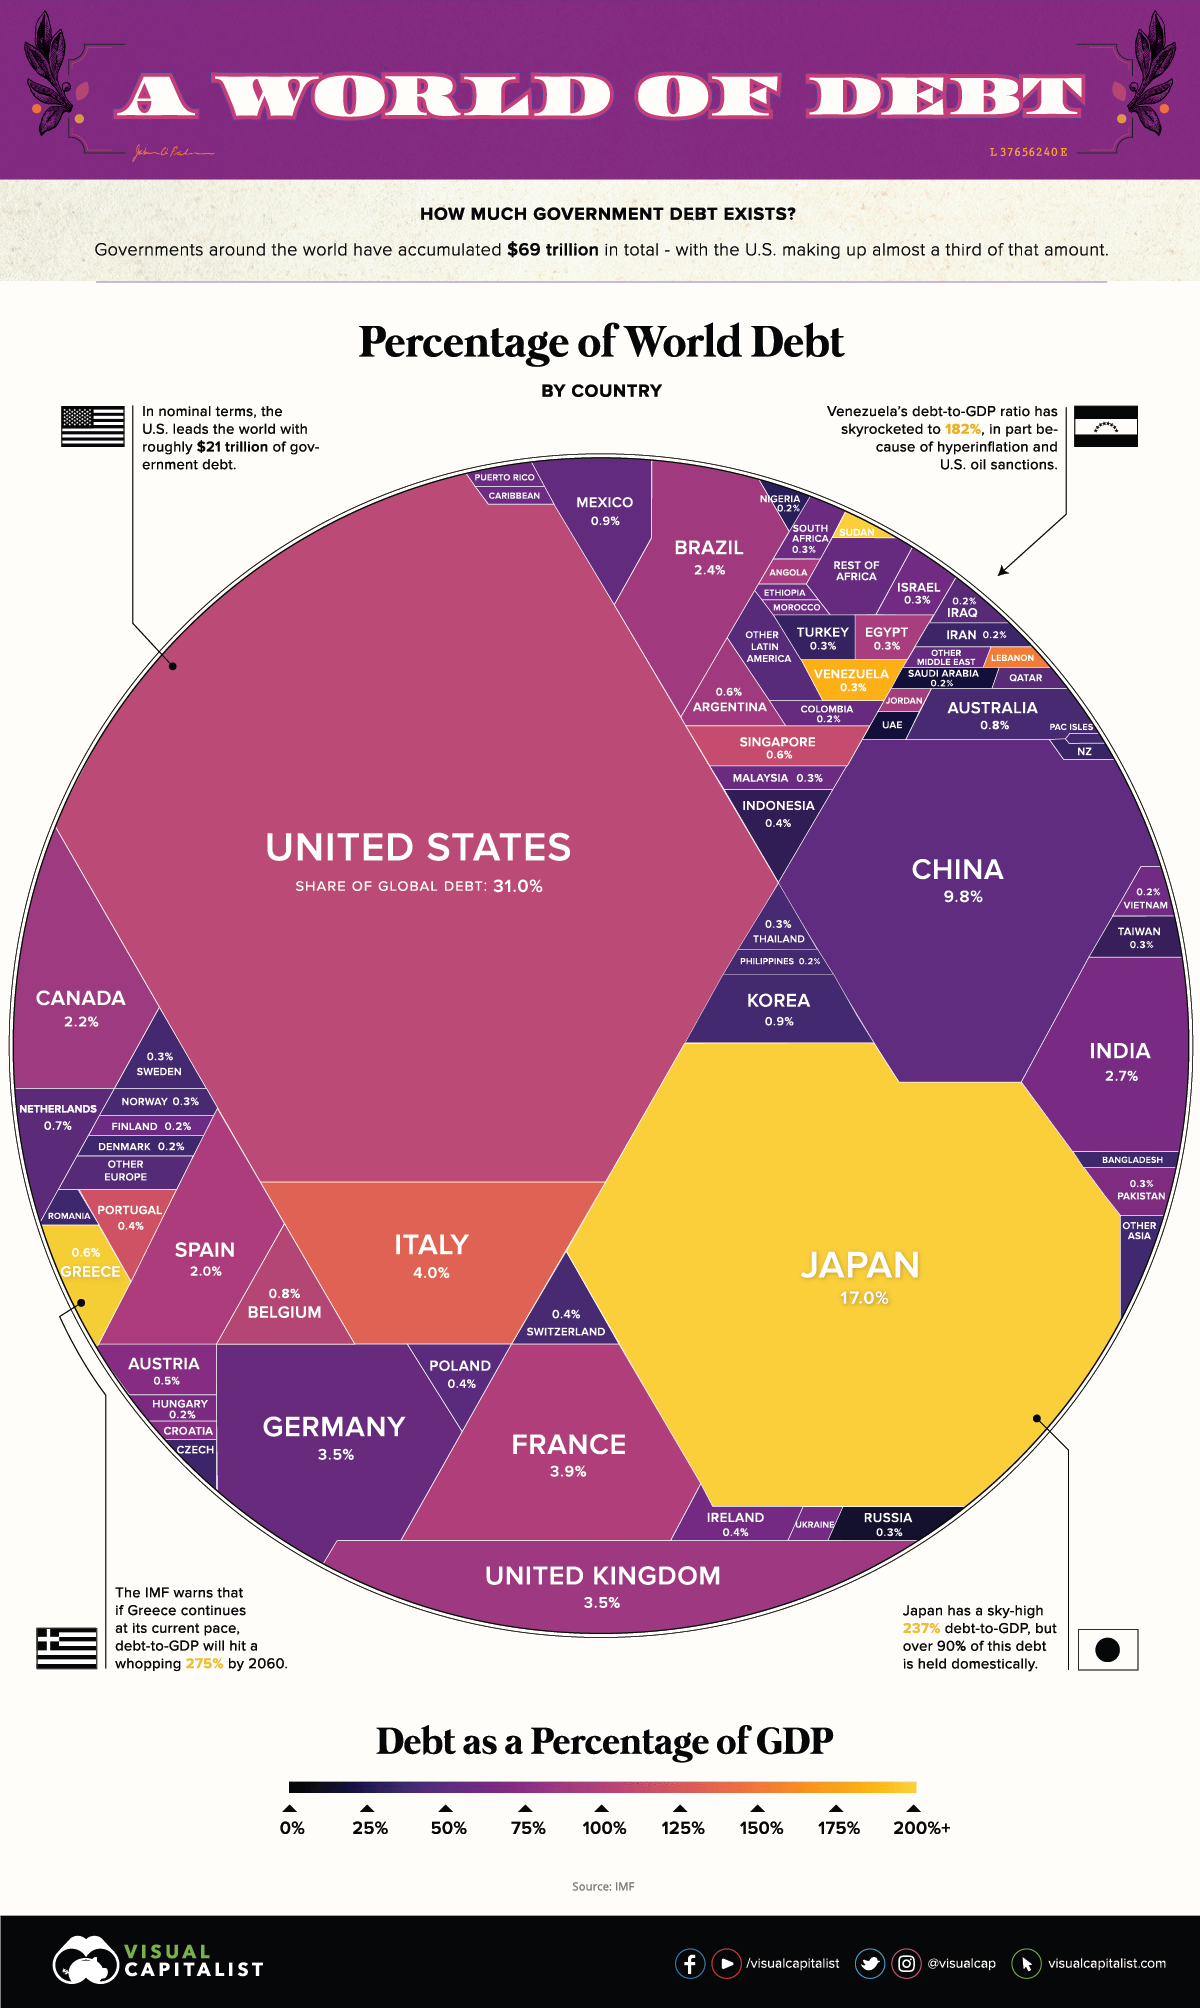
Since then, according to the latest figures by the IMF, the number has ballooned to $69.3 trillion with a debt to GDP ratio of 82% — the highest totals in human history.
Which countries owe the most money, and how do these figures compare?
The Regional Breakdown
Let’s start by looking at the continental level, to get an idea of how world debt is divided from a geographical perspective:
| Region | Debt to GDP | Gross Debt (Billions of USD) | % of Total World Debt |
|---|---|---|---|
| Asia and Pacific | 79.8% | $24,120 | 34.8% |
| North America | 100.4% | $23,710 | 34.2% |
| Europe | 74.2% | $16,225 | 23.4% |
| South America | 75.0% | $2,699 | 3.9% |
| Africa | 56.9% | $1,313 | 1.9% |
| Other | 37.1% | $1,231 | 1.8% |
| World | 81.8% | $69,298 | 100.0% |
In absolute terms, over 90% of global debt is concentrated in North America, Asia Pacific, and Europe — meanwhile, regions like Africa, South America, and other account for less than 10%.
This is not surprising, since advanced economies hold most of the world’s debt (about 75.4%), while emerging or developing economies hold the rest.
World Debt by Country
Now let’s look at individual countries, according to data released by the IMF in October 2019.
It’s worth mentioning that the following numbers are representative of 2018 data, and that for a tiny subset of countries (i.e. Syria) we used the latest available numbers as an estimate.
| Rank | Country | Debt to GDP | Gross Debt ($B) | % of World Total |
|---|---|---|---|---|
| #1 | 🇺🇸 United States | 104.3% | $21,465 | 31.0% |
| #2 | 🇯🇵 Japan | 237.1% | $11,788 | 17.0% |
| #3 | 🇨🇳 China, People's Republic of | 50.6% | $6,764 | 9.8% |
| #4 | 🇮🇹 Italy | 132.2% | $2,744 | 4.0% |
| #5 | 🇫🇷 France | 98.4% | $2,736 | 3.9% |
| #6 | 🇬🇧 United Kingdom | 86.8% | $2,455 | 3.5% |
| #7 | 🇩🇪 Germany | 61.7% | $2,438 | 3.5% |
| #8 | 🇮🇳 India | 68.1% | $1,851 | 2.7% |
| #9 | 🇧🇷 Brazil | 87.9% | $1,642 | 2.4% |
| #10 | 🇨🇦 Canada | 89.9% | $1,540 | 2.2% |
| #11 | 🇪🇸 Spain | 97.1% | $1,386 | 2.0% |
| #12 | 🇲🇽 Mexico | 53.6% | $655 | 0.9% |
| #13 | 🇰🇷 Korea, Republic of | 37.9% | $652 | 0.9% |
| #14 | 🇦🇺 Australia | 41.4% | $588 | 0.8% |
| #15 | 🇧🇪 Belgium | 102.0% | $543 | 0.8% |
| #16 | Netherlands | 52.4% | $479 | 0.7% |
| #17 | Argentina | 86.1% | $447 | 0.6% |
| #18 | Singapore | 113.6% | $414 | 0.6% |
| #19 | Greece | 184.9% | $404 | 0.6% |
| #20 | Austria | 73.8% | $337 | 0.5% |
| #21 | Indonesia | 30.1% | $308 | 0.4% |
| #22 | Portugal | 120.1% | $289 | 0.4% |
| #23 | Poland | 48.9% | $286 | 0.4% |
| #24 | Switzerland | 40.5% | $286 | 0.4% |
| #25 | Ireland | 63.7% | $244 | 0.4% |
| #26 | Russian Federation | 14.6% | $242 | 0.3% |
| #27 | Turkey | 30.2% | $233 | 0.3% |
| #28 | Egypt | 92.7% | $231 | 0.3% |
| #29 | Pakistan | 71.7% | $226 | 0.3% |
| #30 | Israel | 60.8% | $225 | 0.3% |
| #31 | Sweden | 38.5% | $214 | 0.3% |
| #32 | Thailand | 42.1% | $213 | 0.3% |
| #33 | South Africa | 56.7% | $209 | 0.3% |
| #34 | Taiwan Province of China | 35.1% | $207 | 0.3% |
| #35 | Malaysia | 55.6% | $199 | 0.3% |
| #36 | Venezuela | 182.4% | $180 | 0.3% |
| #37 | Norway | 40.0% | $174 | 0.3% |
| #38 | Colombia | 52.2% | $173 | 0.2% |
| #39 | Finland | 59.3% | $163 | 0.2% |
| #40 | Saudi Arabia | 19.0% | $149 | 0.2% |
| #41 | Iran | 32.2% | $144 | 0.2% |
| #42 | Vietnam | 55.6% | $134 | 0.2% |
| #43 | Philippines | 38.9% | $129 | 0.2% |
| #44 | Denmark | 34.3% | $121 | 0.2% |
| #45 | Hungary | 70.8% | $114 | 0.2% |
| #46 | Iraq | 49.3% | $111 | 0.2% |
| #47 | Nigeria | 27.3% | $109 | 0.2% |
| #48 | Bangladesh | 34.0% | $98.1 | 0.14% |
| #49 | Angola | 89.0% | $94.3 | 0.14% |
| #50 | Qatar | 48.6% | $93.0 | 0.13% |
| #51 | Romania | 36.7% | $87.9 | 0.13% |
| #52 | Lebanon | 151.0% | $85.1 | 0.12% |
| #53 | Czech Republic | 32.6% | $79.9 | 0.12% |
| #54 | United Arab Emirates | 19.1% | $79.1 | 0.11% |
| #55 | Ukraine | 60.2% | $78.8 | 0.11% |
| #56 | Morocco | 65.0% | $77.0 | 0.11% |
| #57 | Chile | 25.6% | $76.3 | 0.11% |
| #58 | Sri Lanka | 83.3% | $74.1 | 0.11% |
| #59 | Sudan | 212.1% | $72.7 | 0.10% |
| #60 | Algeria | 38.3% | $66.5 | 0.10% |
| #61 | New Zealand | 29.8% | $60.5 | 0.09% |
| #62 | Peru | 26.1% | $58.8 | 0.08% |
| #63 | Puerto Rico | 55.5% | $56.1 | 0.08% |
| #64 | Kenya | 60.1% | $52.8 | 0.08% |
| #65 | Slovak Republic | 48.9% | $52.1 | 0.08% |
| #66 | Ecuador | 45.8% | $49.6 | 0.07% |
| #67 | Ethiopia | 61.0% | $49.0 | 0.07% |
| #68 | Croatia | 74.6% | $45.4 | 0.07% |
| #69 | Dominican Republic | 50.5% | $43.2 | 0.06% |
| #70 | Oman | 53.4% | $42.3 | 0.06% |
| #71 | Jordan | 94.4% | $39.9 | 0.06% |
| #72 | Ghana | 59.3% | $38.9 | 0.06% |
| #73 | Slovenia | 70.4% | $38.1 | 0.05% |
| #74 | Uruguay | 63.5% | $37.9 | 0.05% |
| #75 | Kazakhstan | 21.0% | $36.3 | 0.05% |
| #76 | Bahrain | 94.7% | $35.7 | 0.05% |
| #77 | Costa Rica | 53.5% | $32.3 | 0.05% |
| #78 | Tunisia | 77.0% | $30.7 | 0.04% |
| #79 | Belarus | 47.8% | $28.5 | 0.04% |
| #80 | Serbia | 54.5% | $27.5 | 0.04% |
| #81 | Myanmar | 38.2% | $26.2 | 0.04% |
| #82 | Panama | 39.5% | $25.7 | 0.04% |
| #83 | Cyprus | 102.5% | $25.1 | 0.04% |
| #84 | Côte d'Ivoire | 53.2% | $22.9 | 0.03% |
| #85 | Bolivia | 53.8% | $21.8 | 0.03% |
| #86 | Tanzania | 37.3% | $21.2 | 0.03% |
| #87 | Zambia | 78.1% | $20.9 | 0.03% |
| #88 | Kuwait | 14.7% | $20.8 | 0.03% |
| #89 | Guatemala | 24.7% | $19.4 | 0.03% |
| #90 | Lithuania | 34.2% | $18.2 | 0.03% |
| #91 | Syria | 30.0% | $18.0 | 0.03% |
| #92 | Yemen | 64.8% | $17.9 | 0.03% |
| #93 | El Salvador | 67.1% | $17.5 | 0.03% |
| #94 | Cameroon | 39.1% | $15.1 | 0.02% |
| #95 | Luxembourg | 21.4% | $14.9 | 0.02% |
| #96 | Jamaica | 94.4% | $14.6 | 0.02% |
| #97 | Senegal | 61.6% | $14.5 | 0.02% |
| #98 | Mozambique | 99.8% | $14.4 | 0.02% |
| #99 | Bulgaria | 20.4% | $13.3 | 0.02% |
| #100 | Latvia | 35.9% | $12.5 | 0.02% |
| #101 | Turkmenistan | 29.1% | $11.9 | 0.02% |
| #102 | Uganda | 41.4% | $11.6 | 0.02% |
| #103 | Albania | 69.9% | $10.5 | 0.02% |
| #104 | Uzbekistan | 20.6% | $10.4 | 0.02% |
| #105 | Lao P.D.R. | 57.2% | $10.4 | 0.01% |
| #106 | Gabon | 60.7% | $10.2 | 0.01% |
| #107 | Congo, Republic of | 87.8% | $10.2 | 0.01% |
| #108 | Trinidad and Tobago | 45.1% | $10.2 | 0.01% |
| #109 | Iceland | 37.6% | $9.8 | 0.01% |
| #110 | Honduras | 40.2% | $9.6 | 0.01% |
| #111 | Mauritius | 66.2% | $9.4 | 0.01% |
| #112 | Paraguay | 21.5% | $9.0 | 0.01% |
| #113 | Azerbaijan | 18.8% | $8.8 | 0.01% |
| #114 | Nepal | 30.2% | $8.8 | 0.01% |
| #115 | Papua New Guinea | 35.5% | $8.2 | 0.01% |
| #116 | Bahamas, The | 63.3% | $7.9 | 0.01% |
| #117 | Zimbabwe | 37.1% | $7.8 | 0.01% |
| #118 | Georgia | 44.9% | $7.3 | 0.01% |
| #119 | Congo, Dem. Rep. of the | 15.3% | $7.2 | 0.01% |
| #120 | Cambodia | 28.6% | $7.0 | 0.01% |
| #121 | Bosnia and Herzegovina | 34.3% | $6.9 | 0.01% |
| #122 | Namibia | 45.8% | $6.6 | 0.01% |
| #123 | Malta | 45.2% | $6.6 | 0.01% |
| #124 | Mali | 37.3% | $6.4 | 0.01% |
| #125 | Barbados | 125.7% | $6.4 | 0.01% |
| #126 | Armenia | 51.3% | $6.4 | 0.01% |
| #127 | Burkina Faso | 42.9% | $6.1 | 0.01% |
| #128 | Equatorial Guinea | 43.3% | $5.9 | 0.01% |
| #129 | Benin | 41.0% | $5.9 | 0.01% |
| #130 | Madagascar | 45.7% | $5.5 | 0.01% |
| #131 | Chad | 48.3% | $5.3 | 0.01% |
| #132 | North Macedonia | 40.5% | $5.1 | 0.01% |
| #133 | Niger | 53.8% | $5.0 | 0.01% |
| #134 | Nicaragua | 37.2% | $4.9 | 0.01% |
| #135 | Guinea | 38.2% | $4.6 | 0.01% |
| #136 | Kyrgyz Republic | 56.0% | $4.5 | 0.01% |
| #137 | Mauritania | 82.9% | $4.3 | 0.01% |
| #138 | Malawi | 62.9% | $4.3 | 0.01% |
| #139 | Togo | 76.2% | $4.1 | 0.01% |
| #140 | Montenegro | 72.6% | $4.0 | 0.01% |
| #141 | Rwanda | 40.7% | $3.9 | 0.01% |
| #142 | Maldives | 68.0% | $3.6 | 0.01% |
| #143 | Tajikistan | 47.9% | $3.6 | 0.01% |
| #144 | Eritrea | 174.3% | $3.5 | 0.01% |
| #145 | Moldova | 29.7% | $3.4 | 0.00% |
| #146 | Haiti | 33.3% | $3.2 | 0.00% |
| #147 | Bhutan | 102.4% | $2.6 | 0.00% |
| #148 | Sierra Leone | 63.0% | $2.6 | 0.00% |
| #149 | Estonia | 8.3% | $2.6 | 0.00% |
| #150 | Fiji | 46.2% | $2.6 | 0.00% |
| #151 | Suriname | 72.8% | $2.5 | 0.00% |
| #152 | Cabo Verde | 124.5% | $2.5 | 0.00% |
| #153 | Aruba | 84.5% | $2.4 | 0.00% |
| #154 | Botswana | 12.1% | $2.3 | 0.00% |
| #155 | Guyana | 52.9% | $2.1 | 0.00% |
| #156 | Burundi | 58.4% | $2.0 | 0.00% |
| #157 | South Sudan, Republic of | 42.2% | $1.9 | 0.00% |
| #158 | Belize | 95.2% | $1.8 | 0.00% |
| #159 | Eswatini | 35.2% | $1.7 | 0.00% |
| #160 | Antigua and Barbuda | 89.5% | $1.4 | 0.00% |
| #161 | Gambia, The | 86.6% | $1.4 | 0.00% |
| #162 | Djibouti | 48.0% | $1.4 | 0.00% |
| #163 | Afghanistan | 6.9% | $1.4 | 0.00% |
| #164 | Kosovo | 17.0% | $1.4 | 0.00% |
| #165 | Liberia | 39.9% | $1.3 | 0.00% |
| #166 | San Marino | 77.9% | $1.3 | 0.00% |
| #167 | Saint Lucia | 64.3% | $1.2 | 0.00% |
| #168 | Lesotho | 44.5% | $1.2 | 0.00% |
| #169 | Central African Republic | 49.9% | $1.1 | 0.00% |
| #170 | Guinea-Bissau | 64.3% | $0.9 | 0.00% |
| #171 | Seychelles | 56.9% | $0.9 | 0.00% |
| #172 | Grenada | 63.5% | $0.8 | 0.00% |
| #173 | Saint Vincent and the Grenadines | 74.5% | $0.6 | 0.00% |
| #174 | Saint Kitts and Nevis | 60.5% | $0.6 | 0.00% |
| #175 | Vanuatu | 51.4% | $0.5 | 0.00% |
| #176 | Samoa | 50.3% | $0.4 | 0.00% |
| #177 | Dominica | 74.1% | $0.4 | 0.00% |
| #178 | Hong Kong SAR | 0.1% | $0.4 | 0.00% |
| #179 | Brunei Darussalam | 2.6% | $0.4 | 0.00% |
| #180 | São Tomé and Príncipe | 74.5% | $0.3 | 0.00% |
| #181 | Comoros | 21.0% | $0.2 | 0.00% |
| #182 | Timor-Leste | 6.1% | $0.2 | 0.00% |
| #183 | Solomon Islands | 9.4% | $0.1 | 0.00% |
| #184 | Micronesia, Fed. States of | 20.3% | $0.1 | 0.00% |
| #185 | Nauru | 58.3% | $0.1 | 0.00% |
| #186 | Marshall Islands | 25.2% | $0.1 | 0.00% |
| #187 | Kiribati | 20.6% | $0.0 | 0.00% |
| #188 | Tuvalu | 28.1% | $0.0 | 0.00% |
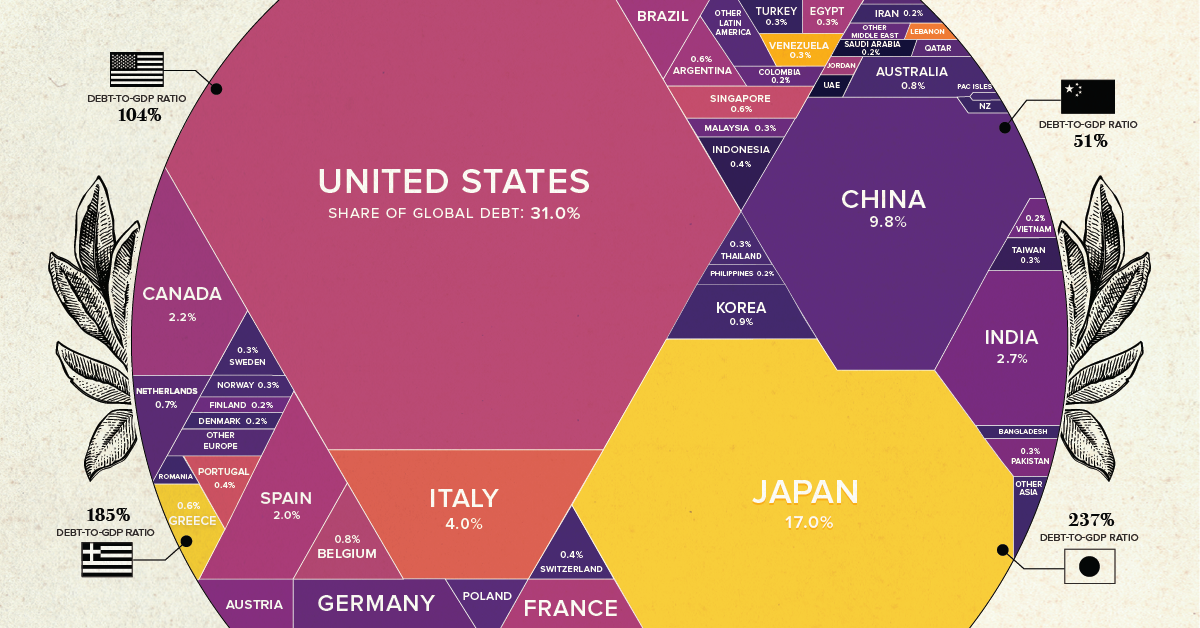
In absolute terms, the most indebted nation is the United States, which has a gross debt of $21.5 trillion according to the IMF as of 2018.
If you’re looking for a more precise figure for 2019, the U.S. government’s “Debt to the Penny” dataset puts the amount owing to exactly $23,015,089,744,090.63 as of November 12, 2019.
Of course, the U.S. is also the world’s largest economy in nominal terms, putting the debt to GDP ratio at 104.3%
Other stand outs from the list above include Japan, which has the highest debt to GDP ratio (237.1%), and China , which has increased government debt by almost $2 trillion in just the last two years. Meanwhile, the European economies of Italy and Belgium check the box as other large debtors with ratios topping 100% debt to GDP.


Markets
The World’s Fastest Growing Emerging Markets (2024-2029 Forecast)
Here are the emerging markets with the fastest projected growth rates over the next five years based on analysis from the IMF.
The World’s Fastest Growing Emerging Markets (2024-2029)
Large emerging markets are forecast to play a greater role in powering global economic growth in the future, driven by demographic shifts and a growing consumer class.
At the same time, many smaller nations are projected to see their economies grow at double the global average over the next five years due to rich natural resource deposits among other factors. That said, elevated debt levels do present risks to future economic activity.
This graphic shows the emerging markets with the fastest projected growth through to 2029, based on data from the International Monetary Fund’s 2024 World Economic Outlook.
Get the Key Insights of the IMF’s World Economic Outlook
Want a visual breakdown of the insights from the IMF’s 2024 World Economic Outlook report?
This visual is part of a special dispatch of the key takeaways exclusively for VC+ members.
Get the full dispatch of charts by signing up to VC+.
Top 10 Emerging Markets
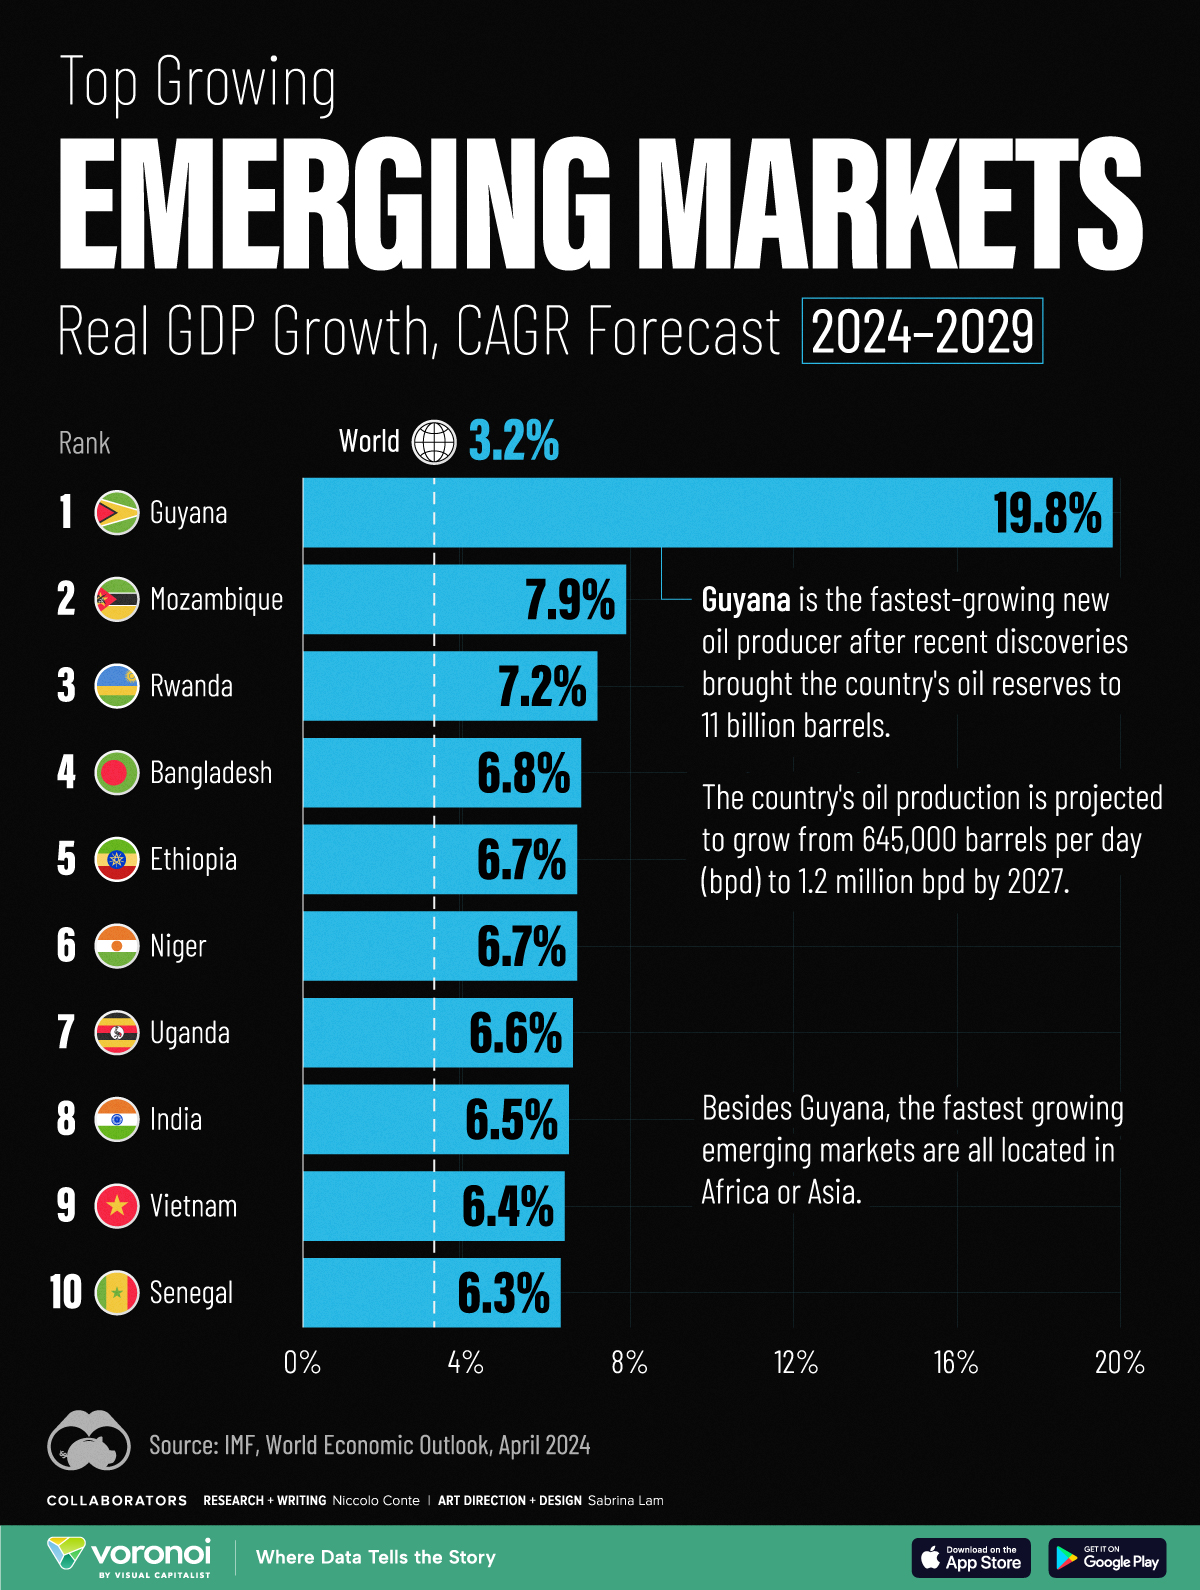
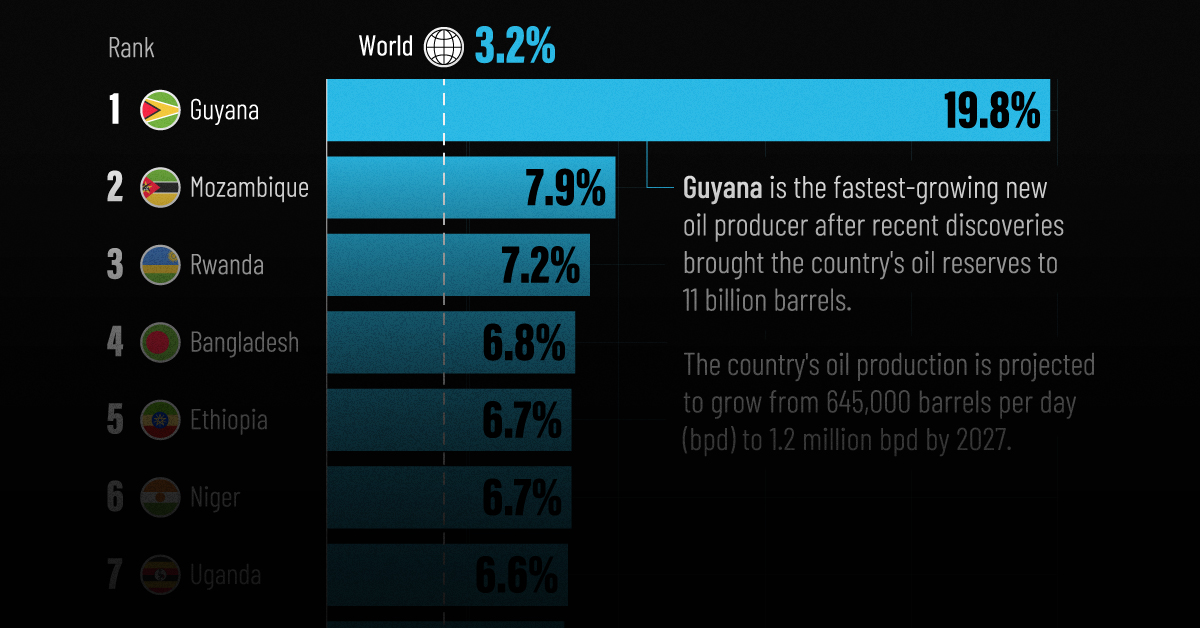
Here are the fastest-growing emerging economies, based on real GDP compound annual growth rate (CAGR) forecasts over the period of 2024-2029:
| Rank | Country | Projected CAGR (2024-2029) |
|---|---|---|
| 1 | 🇬🇾 Guyana | 19.8% |
| 2 | 🇲🇿 Mozambique | 7.9% |
| 3 | 🇷🇼 Rwanda | 7.2% |
| 4 | 🇧🇩 Bangladesh | 6.8% |
| 5 | 🇪🇹 Ethiopia | 6.7% |
| 6 | 🇳🇪 Niger | 6.7% |
| 7 | 🇺🇬 Uganda | 6.6% |
| 8 | 🇮🇳 India | 6.5% |
| 9 | 🇻🇳 Vietnam | 6.4% |
| 10 | 🇸🇳 Senegal | 6.3% |
As South America’s third-smallest nation by land area, Guyana is projected to be the world’s fastest growing economy from now to 2029.
This is thanks to a significant discovery of oil deposits in 2015 by ExxonMobil, which has propelled the country’s economy to grow by fourfold over the last five years alone. By 2028, the nation of just 800,000 people is projected to have the highest crude oil production per capita, outpacing Kuwait for the first time.
Bangladesh, where 85% of exports are driven by the textiles industry, is forecast to see the strongest growth in Asia. In fact, over the last 30 years, the country of 170 million people has not had a single year of negative growth.
In eighth place overall is India, projected to achieve a 6.5% CAGR in real GDP through to 2029. This growth is forecast to be fueled by population trends, public investment, and strong consumer demand.
Get the Full Analysis of the IMF’s Outlook on VC+
This visual is part of an exclusive special dispatch for VC+ members which breaks down the key takeaways from the IMF’s 2024 World Economic Outlook.
For the full set of charts and analysis, sign up for VC+.

-

 Green6 days ago
The Carbon Footprint of Major Travel Methods
-

 Misc2 weeks ago
How Hard Is It to Get Into an Ivy League School?
-

 Debt2 weeks ago
How Debt-to-GDP Ratios Have Changed Since 2000
-

 Sports2 weeks ago
The Highest Earning Athletes in Seven Professional Sports
-

 Science2 weeks ago
Visualizing the Average Lifespans of Mammals
-

 Brands2 weeks ago
How Tech Logos Have Evolved Over Time
-

 Energy1 week ago
Ranked: The Top 10 EV Battery Manufacturers in 2023
-

 Demographics1 week ago
Countries With the Largest Happiness Gains Since 2010