Energy
Visualizing U.S. Consumption of Fuel and Materials per Capita
![]() Subscribe to the Elements free mailing list for more like this
Subscribe to the Elements free mailing list for more like this
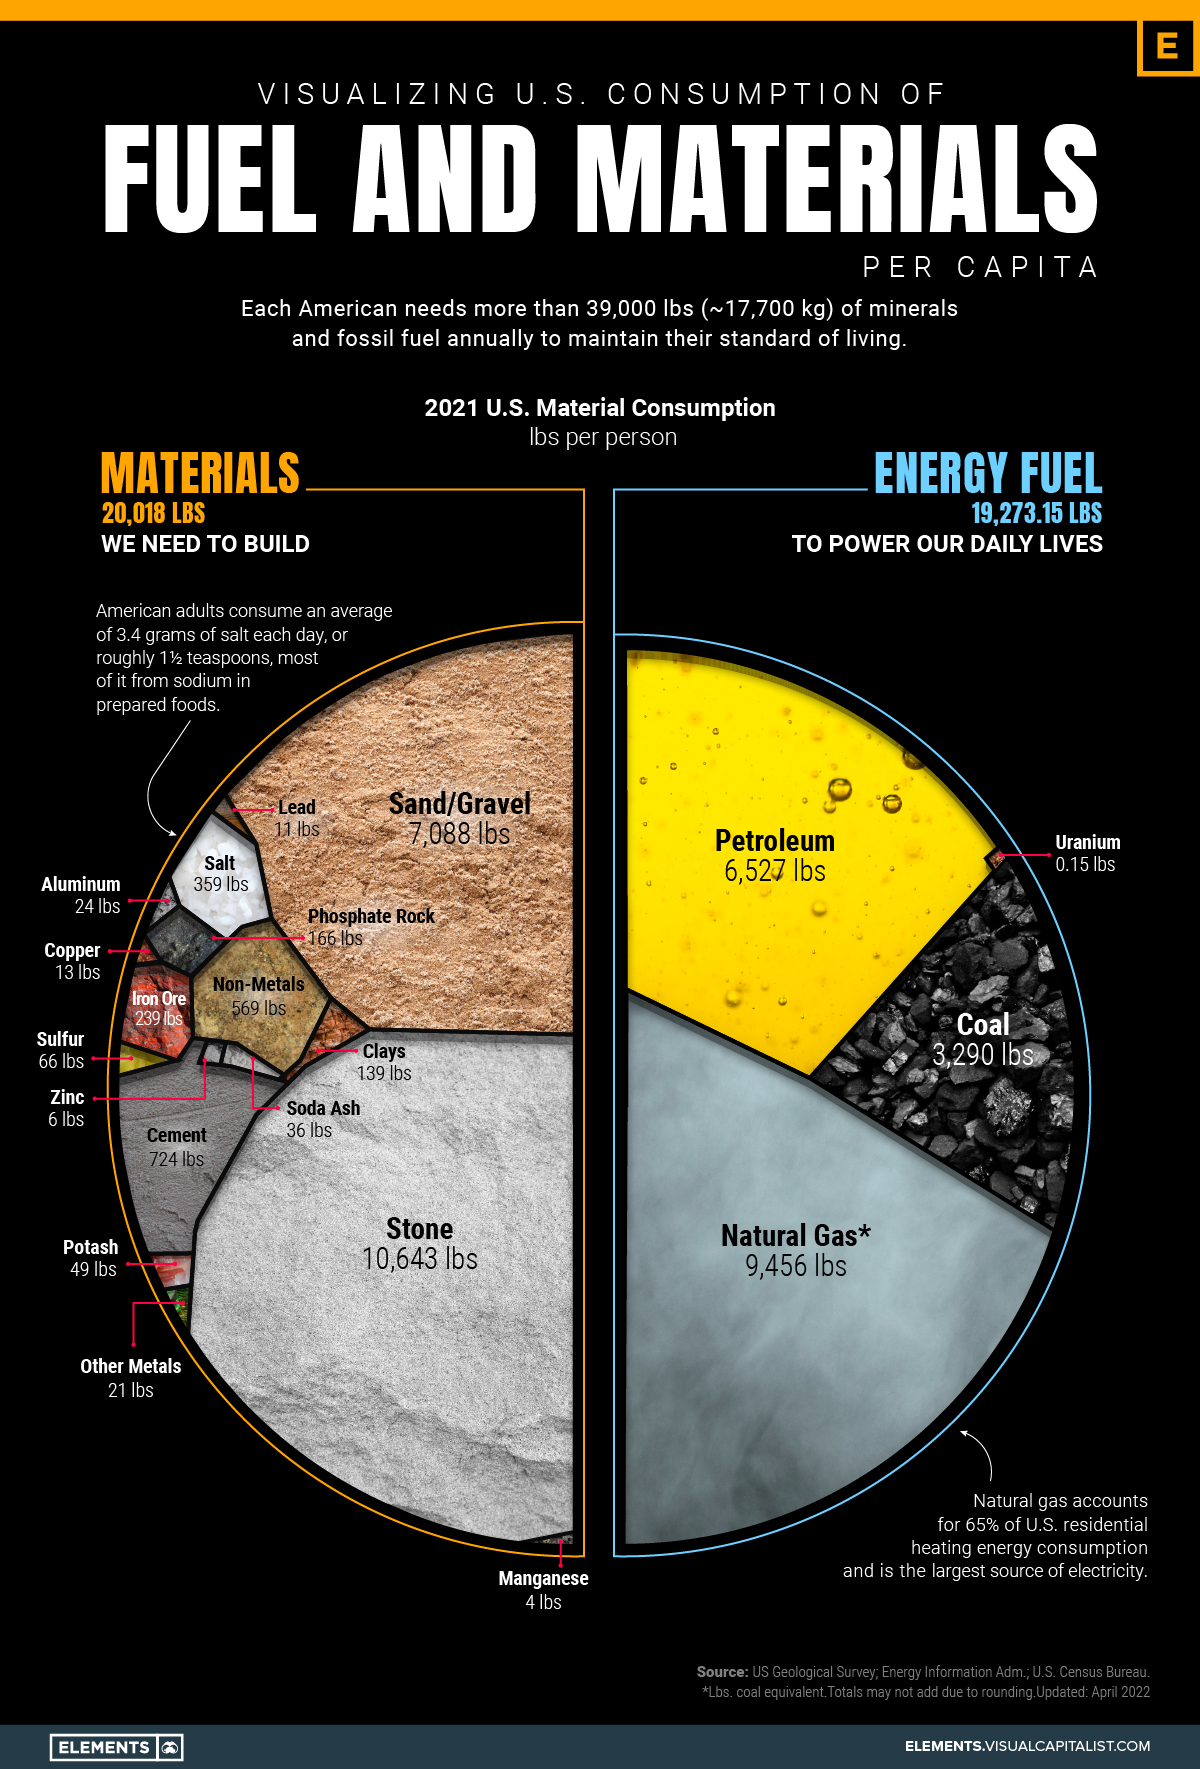
Visualizing U.S. Consumption of Fuel and Materials per Capita
This was originally posted on Elements. Sign up to the free mailing list to get beautiful visualizations on natural resource megatrends in your email every week.
Wealthy countries consume massive amounts of natural resources per capita, and the United States is no exception.
According to data from the National Mining Association, each American needs more than 39,000 pounds (17,700 kg) of minerals and fossil fuels annually to maintain their standard of living.
Materials We Need to Build
Every building around us and every sidewalk we walk on is made of sand, steel, and cement.
As a result, these materials lead consumption per capita in the United States. On average, each person in America drives the demand of over 10,000 lbs of stone and around 7,000 lbs of sand and gravel per year.
| Material/Fossil Fuel | Pounds Per Person |
|---|---|
| Stone | 10,643 |
| Natural Gas | 9,456 |
| Sand, Gravel | 7,088 |
| Petroleum Products | 6,527 |
| Coal | 3,290 |
| Cement | 724 |
| Other Nonmetals | 569 |
| Salt | 359 |
| Iron Ore | 239 |
| Phosphate Rock | 166 |
| Sulfur | 66 |
| Potash | 49 |
| Soda Ash | 36 |
| Bauxite (Aluminum) | 24 |
| Other Metals | 21 |
| Copper | 13 |
| Lead | 11 |
| Zinc | 6 |
| Manganese | 4 |
| Total | 39,291 |
The construction industry is a major contributor to the U.S. economy.
Crushed stone, sand, gravel, and other construction aggregates represent half of the industrial minerals produced in the country, resulting in $29 billion in revenue per year.
Also on the list are crucial hard metals such as copper, aluminum, iron ore, and of course many rarer metals used in smaller quantities each year. These rarer metals can make a big economic difference even when their uses are more concentrated and isolated—for example, palladium (primarily used in catalytic converters) costs $54 million per tonne.
Fuels Powering our Lives
Despite ongoing efforts to fight climate change and reduce carbon emissions, each person in the U.S. uses over 19,000 lbs of fossil fuels per year.
Gasoline is the most consumed petroleum product in the United States.
In 2021, finished motor gasoline consumption averaged about 369 million gallons per day, equal to about 44% of total U.S. petroleum use. Distillate fuel oil (20%), hydrocarbon gas liquids (17%), and jet fuel (7%) were the next most important uses.
Reliance on Other Countries
Over the past three decades, the United States has become reliant on foreign sources to meet domestic demand for minerals and fossil fuels. Today, the country is 100% import-reliant for 17 mineral commodities and at least 50% for 30 others.
In order to reduce the dependency on other countries, namely China, the Biden administration has been working to diversify supply chains in critical minerals. This includes strengthening alliances with other countries such as Australia, India, and Japan.
However, questions still remain about how soon these policies can make an impact, and the degree to which they can ultimately help localize and diversify supply chains.


Energy
Mapped: The Age of Energy Projects in Interconnection Queues, by State
This map shows how many energy projects are in interconnection queues by state and how long these projects have been queued up, on average.


Age of Energy Projects in Interconnection Queues, by State
This was originally posted on our Voronoi app. Download the app for free on iOS or Android and discover incredible data-driven charts from a variety of trusted sources.
By the end of 2023, more than 11,000 energy projects were in interconnection queues in the United States, waiting for a green-light from regional grid operators to proceed with construction.
This map, created in partnership with the National Public Utilities Council, maps out the average age of active energy projects in interconnection queues by state, using data from Berkeley Lab.
Interconnection Queues, Explained
Interconnection queues are lists of energy projects that have made interconnection requests to their regional grid operators. Once submitted, these requests formally initiate the impact study process that each project goes through before grid connection, forming waiting lists for approval known as interconnection queues.
In recent years, both the number and generation capacity of queued projects have surged in the United States, along with the length of time spent in queue.
According to Berkeley Lab, the amount of generation capacity entering queues each year has risen by more than 550% from 2015 to 2023, with average queue duration rising from 3 years to 5 years the same period.
As a result of the growing backlog, a large proportion of projects ultimately withdraw from queues, leading to only 19% of applications reaching commercial operations.
The Backlog: Number of Projects and Average Wait Times
Of the 11,000 active projects in U.S. queues at the end of 2023, Texas, California, and Virginia had the most in queue; 1,208, 947, and 743, respectively.
When looking at the average ages of these projects, all three states hovered around the national average of 34 months (2.83 years), with Texas sporting 28 months, California 33, and Virginia 34.
Vermont, Minnesota, Wisconsin, and Florida, on the other hand, had the highest average queue durations; 54, 49, 47, and 46 months, respectively.
Average Queue Duration by Project Type
At the end of 2023, more than 95% of the generation capacity in active interconnection queues was for emission-free resources. The table below provides a breakdown.
| Project Type | Average Queue Duration (As of 12/31/2023) | Number of Projects in Queue |
|---|---|---|
| Wind | 40 months | 841 |
| Solar | 34 months | 4,506 |
| Wind+Battery | 34 months | 76 |
| Solar+Battery | 27 months | 2,377 |
| Battery | 24 months | 2,818 |
Wind projects had the highest wait times at the end of 2023 with an average age of 40 months (3.33 years). Solar projects, on the other hand, made up more than 40% of projects in queue.
Overall, reducing the time that these renewable energy projects spend in queues can accelerate the transition to a low-carbon energy future.
According to the U.S. Department of Energy, enhancing data transparency, streamlining approval processes, promoting economic efficiency, and maintaining a reliable grid are some of the ways this growing backlog can be mitigated.

-

 Culture6 days ago
The World’s Top Media Franchises by All-Time Revenue
-

 Science2 weeks ago
Visualizing the Average Lifespans of Mammals
-

 Brands2 weeks ago
How Tech Logos Have Evolved Over Time
-

 Energy2 weeks ago
Ranked: The Top 10 EV Battery Manufacturers in 2023
-

 Demographics2 weeks ago
Countries With the Largest Happiness Gains Since 2010
-

 Economy2 weeks ago
VC+: Get Our Key Takeaways From the IMF’s World Economic Outlook
-

 Demographics2 weeks ago
The Countries That Have Become Sadder Since 2010
-

 Money1 week ago
Charted: Who Has Savings in This Economy?