Misc
Which College Degrees Get the Highest Salaries?
Which College Degrees Get the Highest Salaries?
If you’re a college graduate, you likely went to school to pursue an important passion of yours.
But as we all know, what we major in has consequences that extend far beyond the foundation of knowledge we build in our early years. Any program we choose to enroll in also sets up a track to meet future friends, career opportunities, and connections.
Even further, the college degree you choose will partially dictate your future earning potential – especially in the first decade after school. If jobs in your field are in high demand, it can even set you up for long-term financial success, enabling you to pay off costly student loans and build up savings potential.
Data Backgrounder
Today’s chart comes to us from Reddit user /r/SportsAnalyticsGuy, and it’s based on PayScale’s year-long survey of 1.2 million users that graduated only with a bachelor degree in the United States. You can access the full set of data here.
The data covers two different salary categories:
Starting median salary: The median of what people were earning after they graduated with their degree.
Mid-career Percentiles: Salary data from 10 years after graduation, sorted by percentile (10th, 25th, Median, 75th, and 90th)
In other words, the starting median salary represents what people started making after they graduated, and the rest of the chart depicts the range that people were making 10 years after they got their degree. Lower earners (10th percentile) are the lower bound, and higher earners (90th) are the upper bound.
College Degrees, by Salary
What college majors win out?
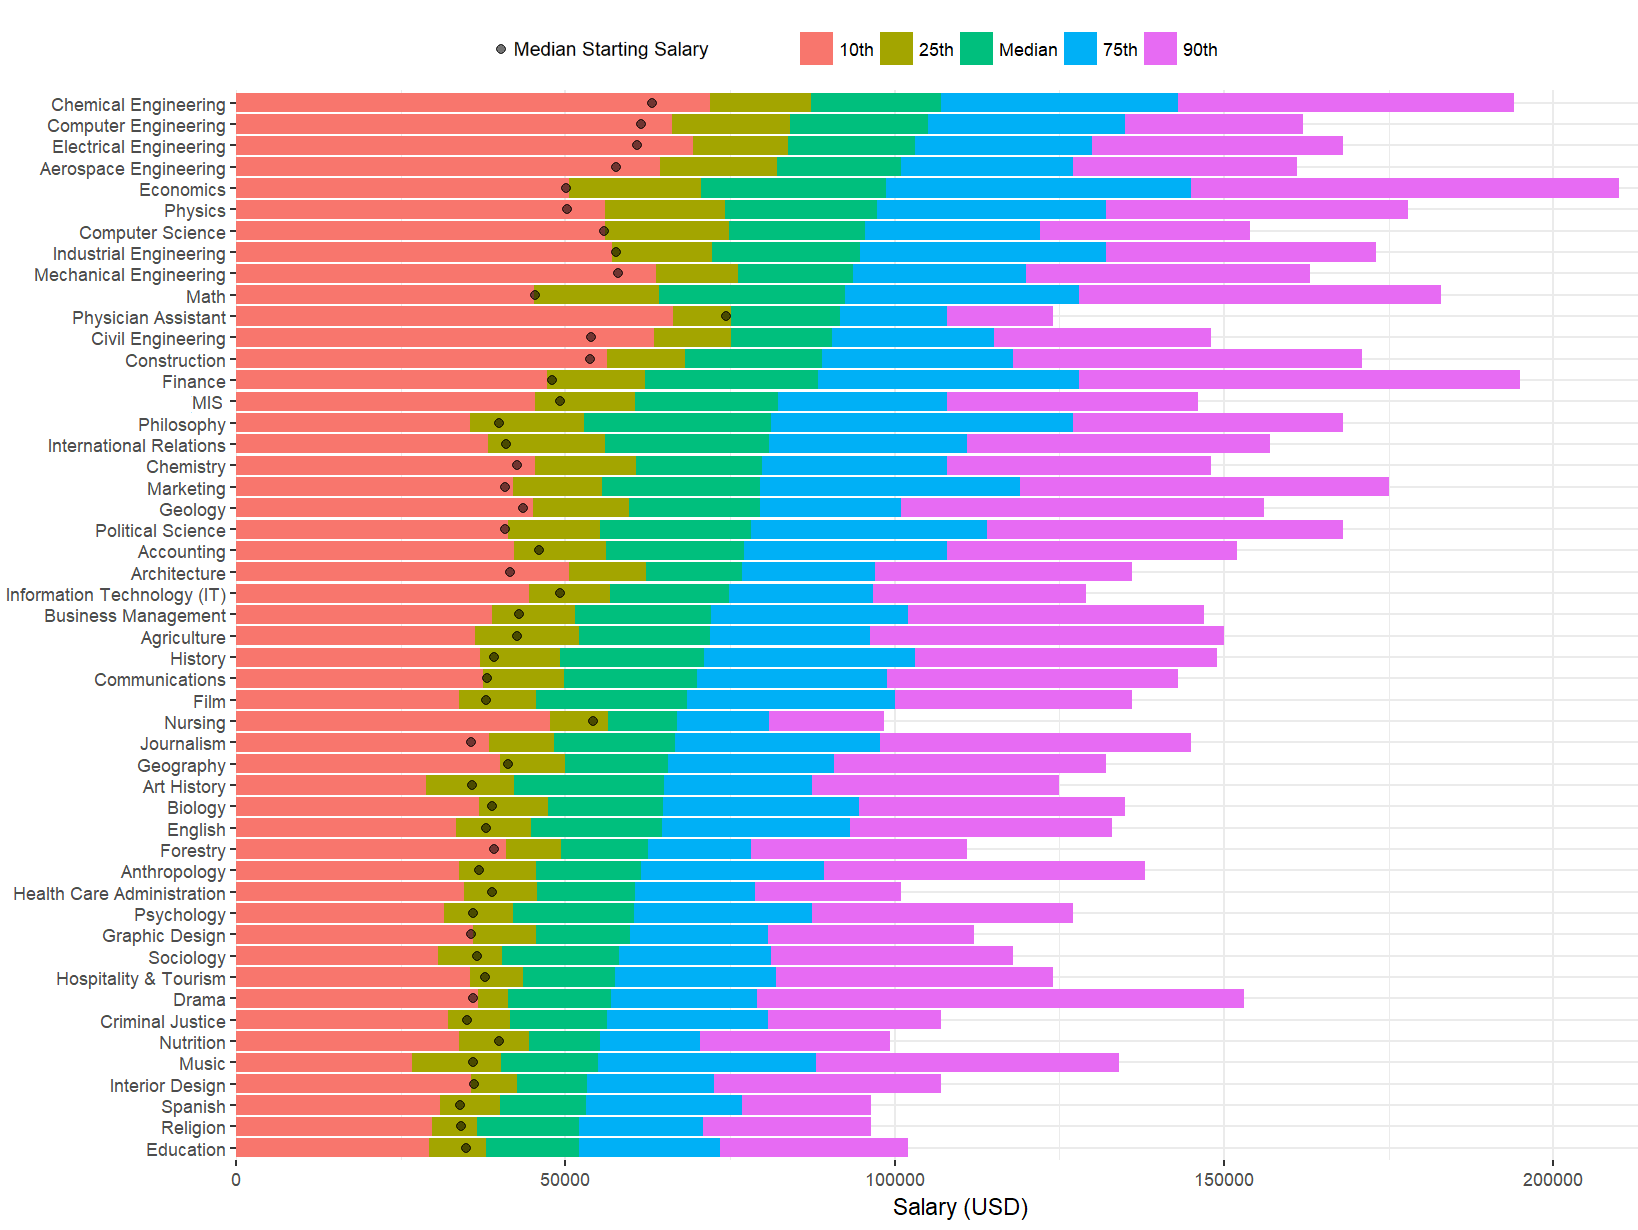
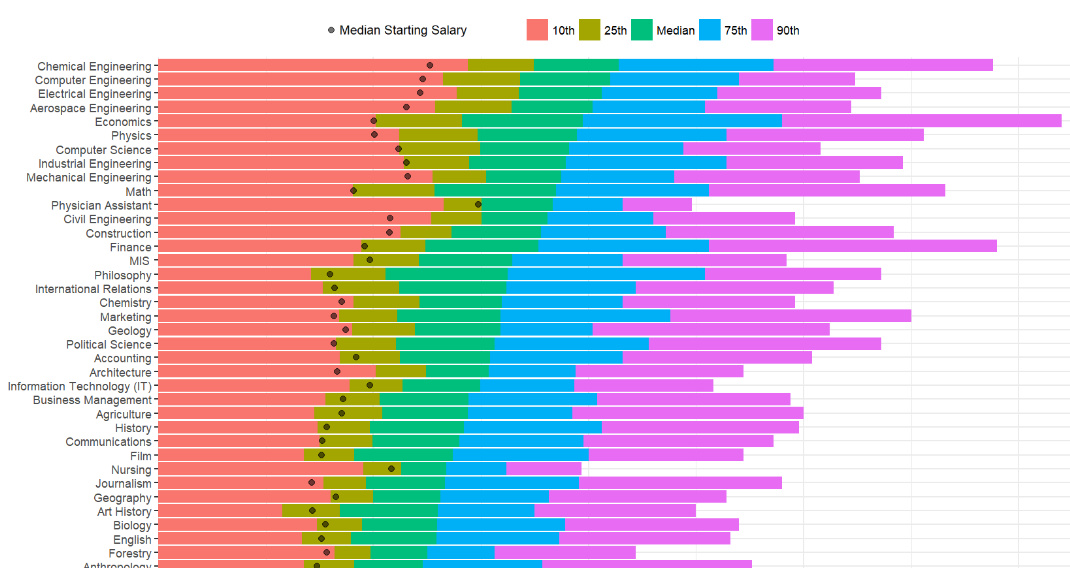
Here’s all 50 majors from the data set, sorted by mid-career median salary (10 years in):
| Rank | Undergraduate Major | Starting Median | Mid-Career Median | % Change |
|---|---|---|---|---|
| #1 | Chemical Engineering | $63,200 | $107,000 | 69.3% |
| #2 | Computer Engineering | $61,400 | $105,000 | 71.0% |
| #3 | Electrical Engineering | $60,900 | $103,000 | 69.1% |
| #4 | Aerospace Engineering | $57,700 | $101,000 | 75.0% |
| #5 | Economics | $50,100 | $98,600 | 96.8% |
| #6 | Physics | $50,300 | $97,300 | 93.4% |
| #7 | Computer Science | $55,900 | $95,500 | 70.8% |
| #8 | Industrial Engineering | $57,700 | $94,700 | 64.1% |
| #9 | Mechanical Engineering | $57,900 | $93,600 | 61.7% |
| #10 | Math | $45,400 | $92,400 | 103.5% |
| #11 | Physician Assistant | $74,300 | $91,700 | 23.4% |
| #12 | Civil Engineering | $53,900 | $90,500 | 67.9% |
| #13 | Construction | $53,700 | $88,900 | 65.5% |
| #14 | Finance | $47,900 | $88,300 | 84.3% |
| #15 | Management Information Systems (MIS) | $49,200 | $82,300 | 67.3% |
| #16 | Philosophy | $39,900 | $81,200 | 103.5% |
| #17 | International Relations | $40,900 | $80,900 | 97.8% |
| #18 | Chemistry | $42,600 | $79,900 | 87.6% |
| #19 | Marketing | $40,800 | $79,600 | 95.1% |
| #20 | Geology | $43,500 | $79,500 | 82.8% |
| #21 | Political Science | $40,800 | $78,200 | 91.7% |
| #22 | Accounting | $46,000 | $77,100 | 67.6% |
| #23 | Architecture | $41,600 | $76,800 | 84.6% |
| #24 | Information Technology (IT) | $49,100 | $74,800 | 52.3% |
| #25 | Business Management | $43,000 | $72,100 | 67.7% |
| #26 | Agriculture | $42,600 | $71,900 | 68.8% |
| #27 | History | $39,200 | $71,000 | 81.1% |
| #28 | Communications | $38,100 | $70,000 | 83.7% |
| #29 | Film | $37,900 | $68,500 | 80.7% |
| #30 | Nursing | $54,200 | $67,000 | 23.6% |
| #31 | Journalism | $35,600 | $66,700 | 87.4% |
| #32 | Geography | $41,200 | $65,500 | 59.0% |
| #33 | Art History | $35,800 | $64,900 | 81.3% |
| #34 | Biology | $38,800 | $64,800 | 67.0% |
| #35 | English | $38,000 | $64,700 | 70.3% |
| #36 | Forestry | $39,100 | $62,600 | 60.1% |
| #37 | Anthropology | $36,800 | $61,500 | 67.1% |
| #38 | Health Care Administration | $38,800 | $60,600 | 56.2% |
| #39 | Psychology | $35,900 | $60,400 | 68.2% |
| #40 | Graphic Design | $35,700 | $59,800 | 67.5% |
| #41 | Sociology | $36,500 | $58,200 | 59.5% |
| #42 | Hospitality & Tourism | $37,800 | $57,500 | 52.1% |
| #43 | Drama | $35,900 | $56,900 | 58.5% |
| #44 | Criminal Justice | $35,000 | $56,300 | 60.9% |
| #45 | Nutrition | $39,900 | $55,300 | 38.6% |
| #46 | Music | $35,900 | $55,000 | 53.2% |
| #47 | Interior Design | $36,100 | $53,200 | 47.4% |
| #48 | Spanish | $34,000 | $53,100 | 56.2% |
| #49 | Education | $34,900 | $52,000 | 49.0% |
| #50 | Religion | $34,100 | $52,000 | 52.5% |
Based on this data, there are a few interesting things to point out.
The top earning specialization out of college is for Physician Assistants, with a median starting salary of $74,300. The downside of this degree is that earning potential levels out quickly, only showing a 23.4% increase in earning power 10 years in.
In contrast, the biggest increases in earning power go to Math, Philosophy, Economics, Marketing, Physics, Political Science, and International Relations majors. All these degrees see a 90% or higher increase from median starting salary to median mid-career salary.
In absolute terms, the majors that saw the highest median mid-career salaries were all along the engineering spectrum: chemical engineering, computer engineering, electrical engineering, and aerospace engineering all came in above $100,000. They also generally had very high starting salaries.
As a final note, it’s important to recognize that this data does not necessarily correlate to today’s degrees or job market. The data set is based on people that graduated at least a decade ago – and therefore, it does not necessarily represent what grads may experience as they are starting their careers today.


VC+
VC+: Get Our Key Takeaways From the IMF’s World Economic Outlook
A sneak preview of the exclusive VC+ Special Dispatch—your shortcut to understanding IMF’s World Economic Outlook report.

Have you read IMF’s latest World Economic Outlook yet? At a daunting 202 pages, we don’t blame you if it’s still on your to-do list.
But don’t worry, you don’t need to read the whole April release, because we’ve already done the hard work for you.
To save you time and effort, the Visual Capitalist team has compiled a visual analysis of everything you need to know from the report—and our VC+ Special Dispatch is available exclusively to VC+ members. All you need to do is log into the VC+ Archive.
If you’re not already subscribed to VC+, make sure you sign up now to access the full analysis of the IMF report, and more (we release similar deep dives every week).
For now, here’s what VC+ members get to see.
Your Shortcut to Understanding IMF’s World Economic Outlook
With long and short-term growth prospects declining for many countries around the world, this Special Dispatch offers a visual analysis of the key figures and takeaways from the IMF’s report including:
- The global decline in economic growth forecasts
- Real GDP growth and inflation forecasts for major nations in 2024
- When interest rate cuts will happen and interest rate forecasts
- How debt-to-GDP ratios have changed since 2000
- And much more!

Get the Full Breakdown in the Next VC+ Special Dispatch
VC+ members can access the full Special Dispatch by logging into the VC+ Archive, where you can also check out previous releases.
Make sure you join VC+ now to see exclusive charts and the full analysis of key takeaways from IMF’s World Economic Outlook.
Don’t miss out. Become a VC+ member today.
What You Get When You Become a VC+ Member
VC+ is Visual Capitalist’s premium subscription. As a member, you’ll get the following:
- Special Dispatches: Deep dive visual briefings on crucial reports and global trends
- Markets This Month: A snappy summary of the state of the markets and what to look out for
- The Trendline: Weekly curation of the best visualizations from across the globe
- Global Forecast Series: Our flagship annual report that covers everything you need to know related to the economy, markets, geopolitics, and the latest tech trends
- VC+ Archive: Hundreds of previously released VC+ briefings and reports that you’ve been missing out on, all in one dedicated hub
You can get all of the above, and more, by joining VC+ today.

-

 Mining1 week ago
Gold vs. S&P 500: Which Has Grown More Over Five Years?
-

 Markets2 weeks ago
Ranked: The Most Valuable Housing Markets in America
-

 Money2 weeks ago
Which States Have the Highest Minimum Wage in America?
-

 AI2 weeks ago
Ranked: Semiconductor Companies by Industry Revenue Share
-

 Markets2 weeks ago
Ranked: The World’s Top Flight Routes, by Revenue
-

 Countries2 weeks ago
Population Projections: The World’s 6 Largest Countries in 2075
-

 Markets2 weeks ago
The Top 10 States by Real GDP Growth in 2023
-

 Demographics2 weeks ago
The Smallest Gender Wage Gaps in OECD Countries