Politics
The Official and Ceremonial Vehicles of World Leaders
The Official and Ceremonial Vehicles of World Leaders
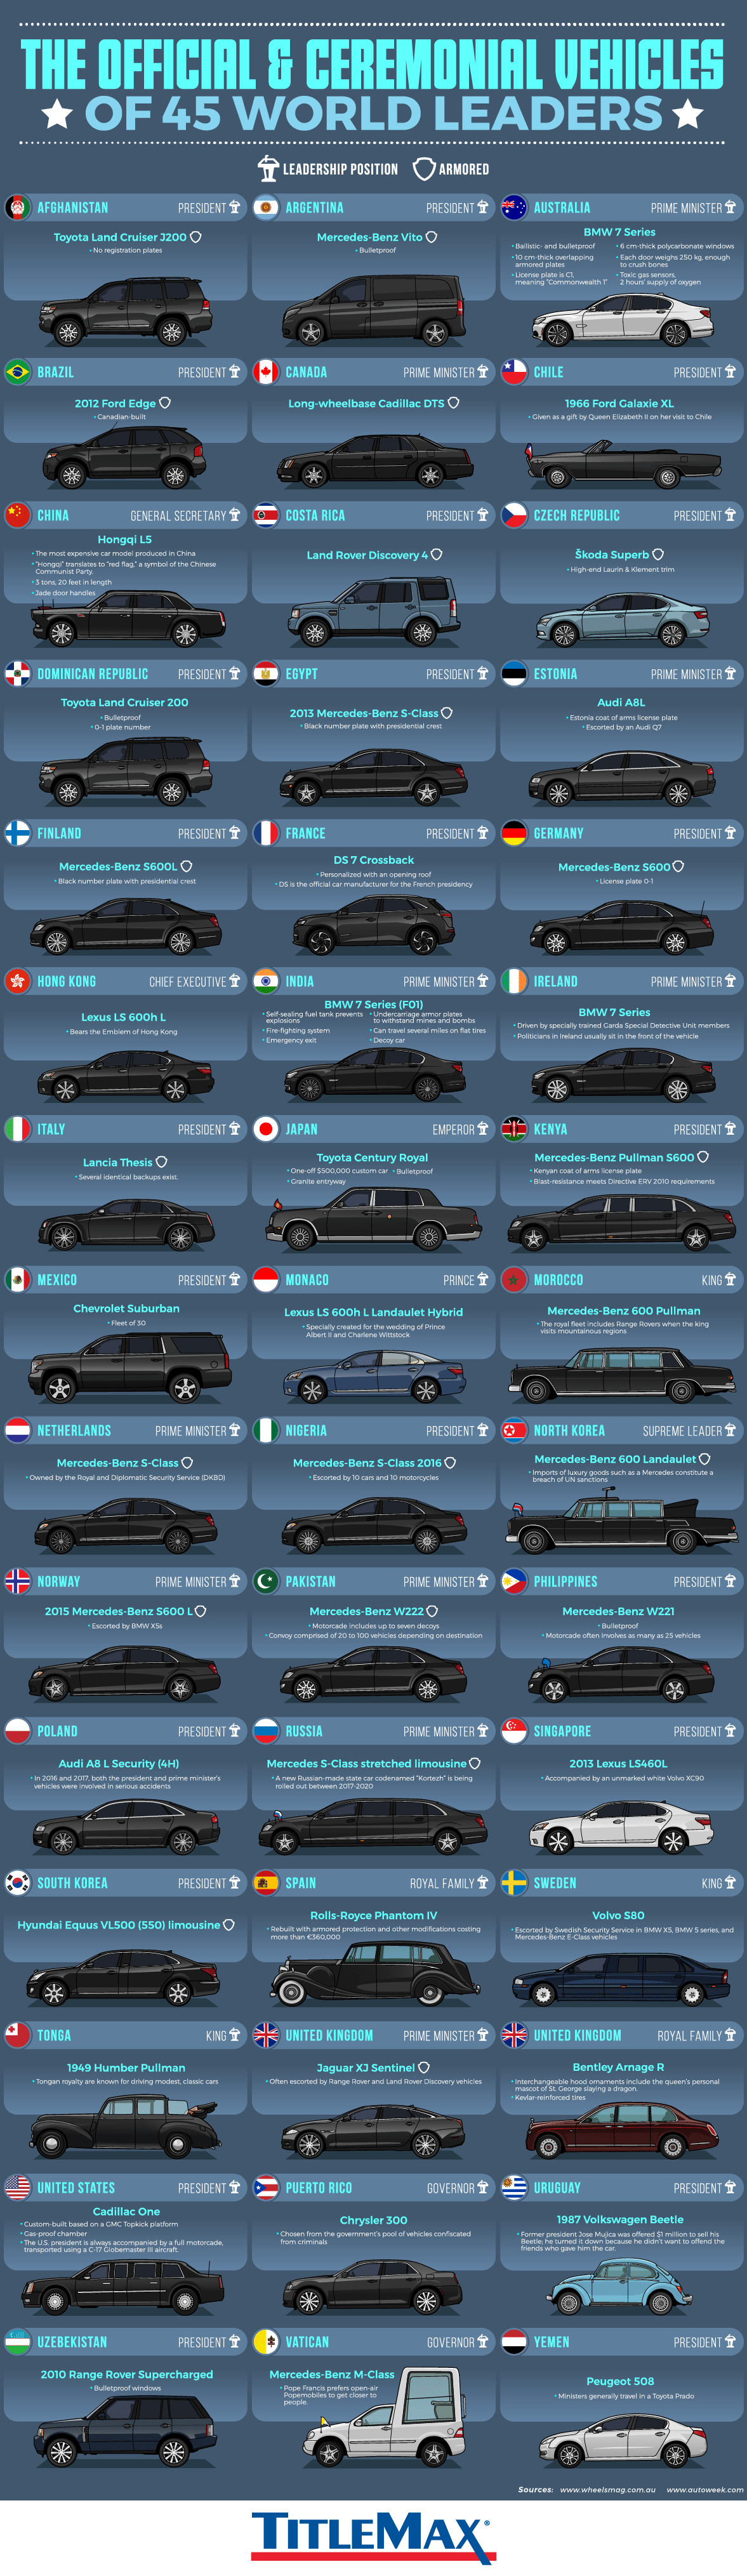
Transporting world leaders from A-to-B is a complex endeavor, usually accomplished using motorcades, escorts, roadblocks, and all sorts of bullet and bombproof vehicles. Incorporating that level of technological sophistication into a stylish vehicle worthy of transporting and head of state is no easy task.
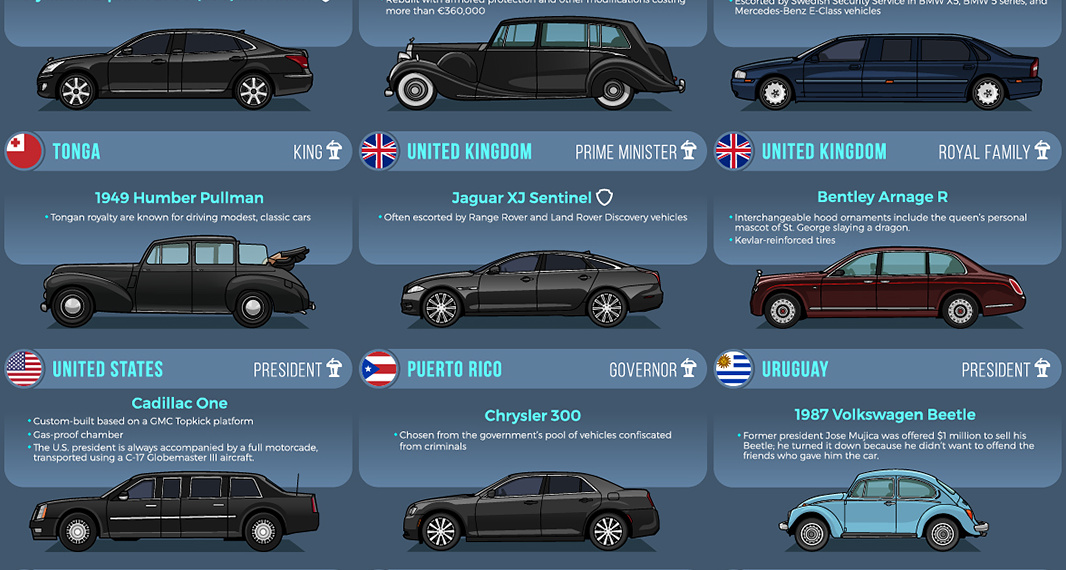
Today’s graphic looks at official state vehicles, from the unparalleled Cadillac One that transports President Trump, to the understated ’87 Volkswagen Beetle driven by former Uruguayan president, Josè Mujica.
The Official Official Vehicle
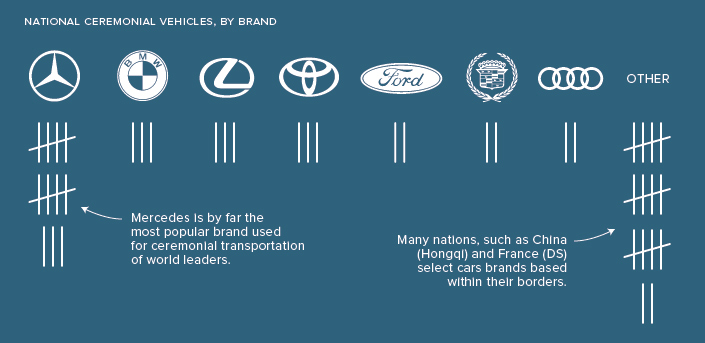
According to data from TitleMax, the overwhelming favorite car brand for world leaders is Mercedes–Benz, particularly the S-Class.
Many countries use luxury brands such as Mercedes–Benz and BMW to transport their heads of state, though it’s also a popular move select domestic brands for such an important and highly symbolic task. The United States, Japan, China, Germany, United Kingdom, France, and Sweden are all examples of countries that chose vehicles made by domestic brands.
Safety First
The United States spares little expense in keeping the president safe, and President Trump’s Cadillac One, nicknamed “The Beast“, is no exception.
As one would expect, the vehicle is heavily armored, with doors that weigh as much as the ones on a Boeing 757. There are also some unique features packed into the vehicle, such as tear gas launchers, and pints of blood that match the president’s blood type.
Australia’s Prime Minister, Malcolm Turnbull, rides in a BMW 7 Series that boasts some impressive safety features, including on-board oxygen supply and toxic gas sensors.
Old School Cool
While many nations fleets consist of modern luxury vehicles, some heads of state opt for vintage rides.
The former King of Tonga, George Tupou V, preferred traveling in vintage cars, such as a 1949 Humber Pullman and his customized London taxi.
An English taxi is extremely easy to get in and out of wearing a sword, a spiked helmet or spurs.
The Rolls-Royce Phantom IV is, in some ways, the quintessential vehicle for pomp and circumstance. Only 18 of the vehicles were made between 1950 and 1956, and all were purchased by royal families and heads of state. Three of these historical vehicles are still in use by the Spanish head of state for ceremonial occasions.
During special events, Chilean leaders cruise in a 1966 Ford Galaxie. The car, which has been in use for decades, was a gift from the Queen Elizabeth II.
Going Dutch
Prime Minister of the Netherlands, Mark Rutte, occasionally ditches his Mercedes–Benz S-Class to ride his bike to meetings. That may seem unusual in some parts of the world, but not in the Netherlands where nearly a quarter of the country’s population rides a bicycle on any given day.


War
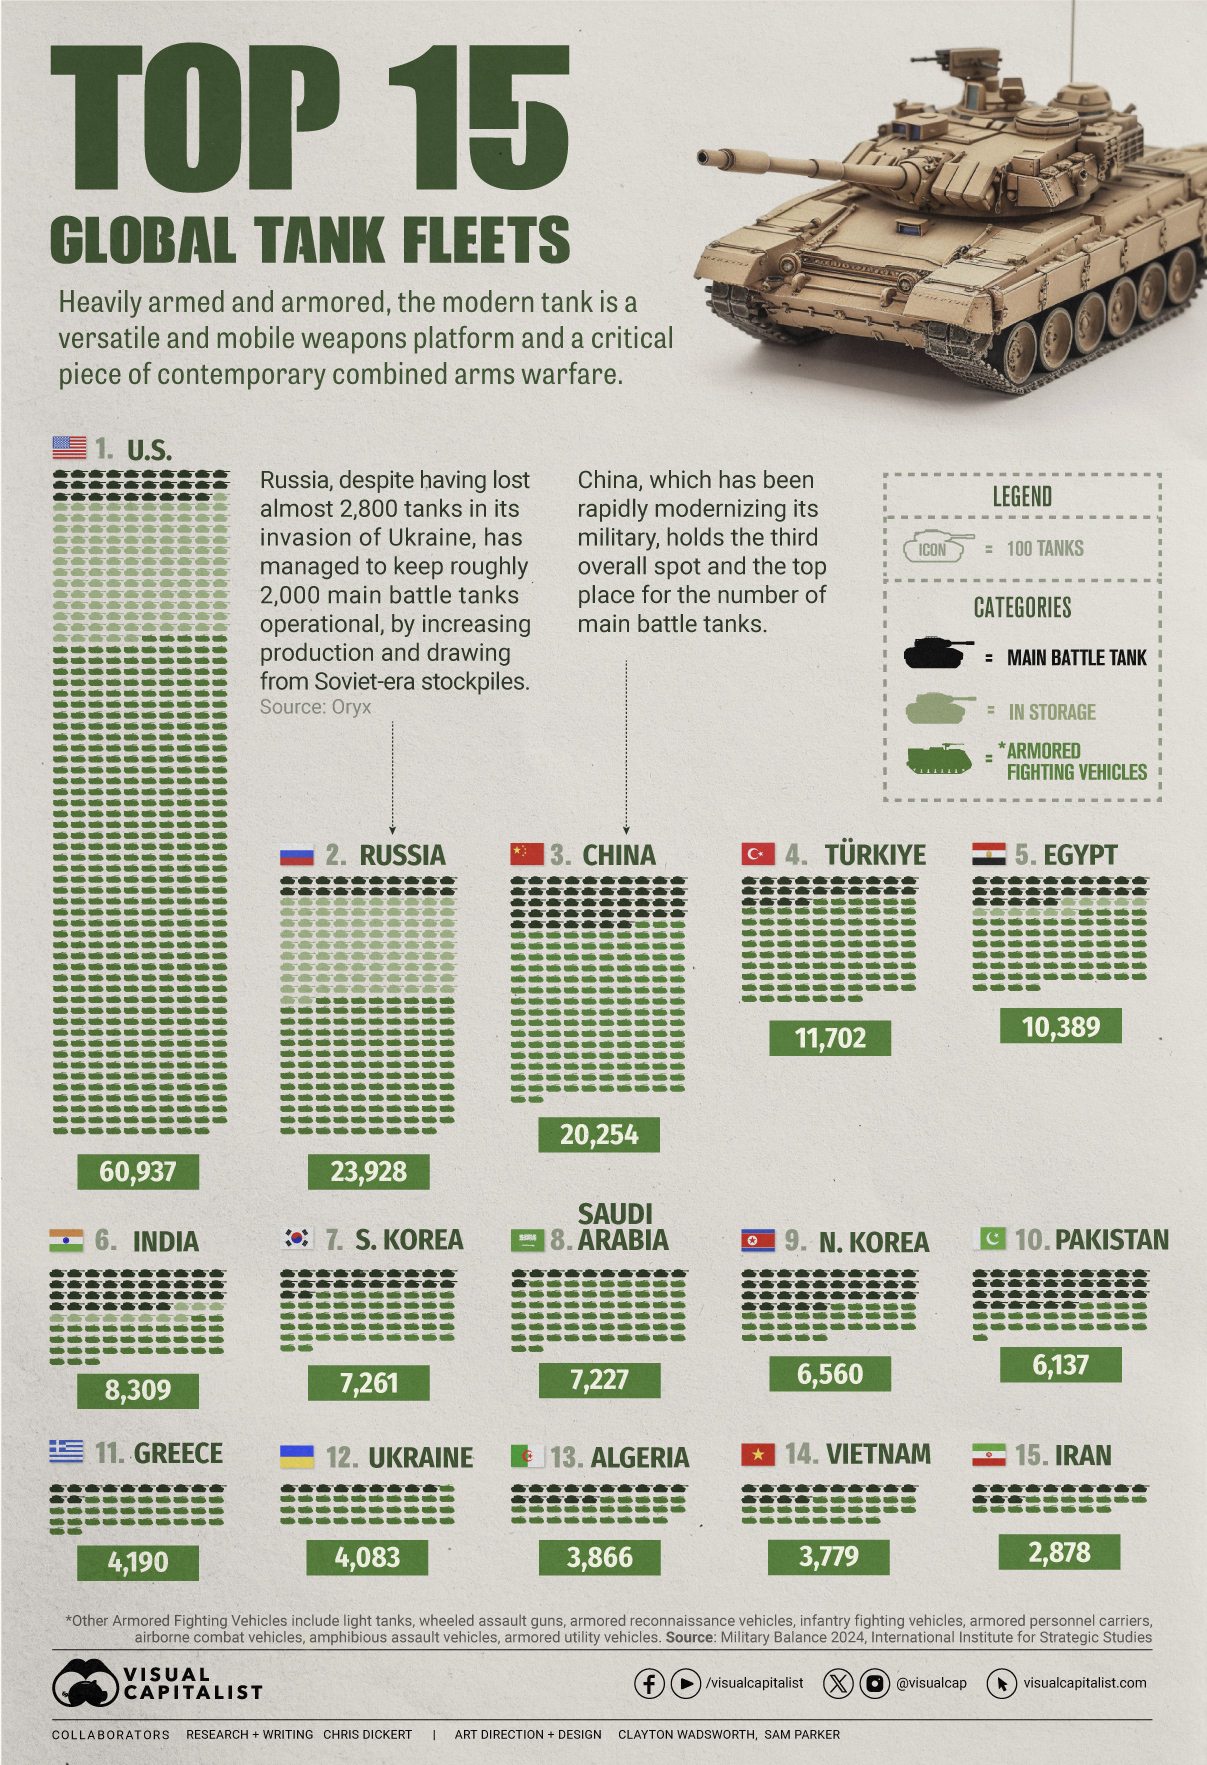
Visualized: Top 15 Global Tank Fleets
Heavily armed and armored, the modern tank is a versatile and mobile weapons platform, and a critical piece of contemporary warfare.
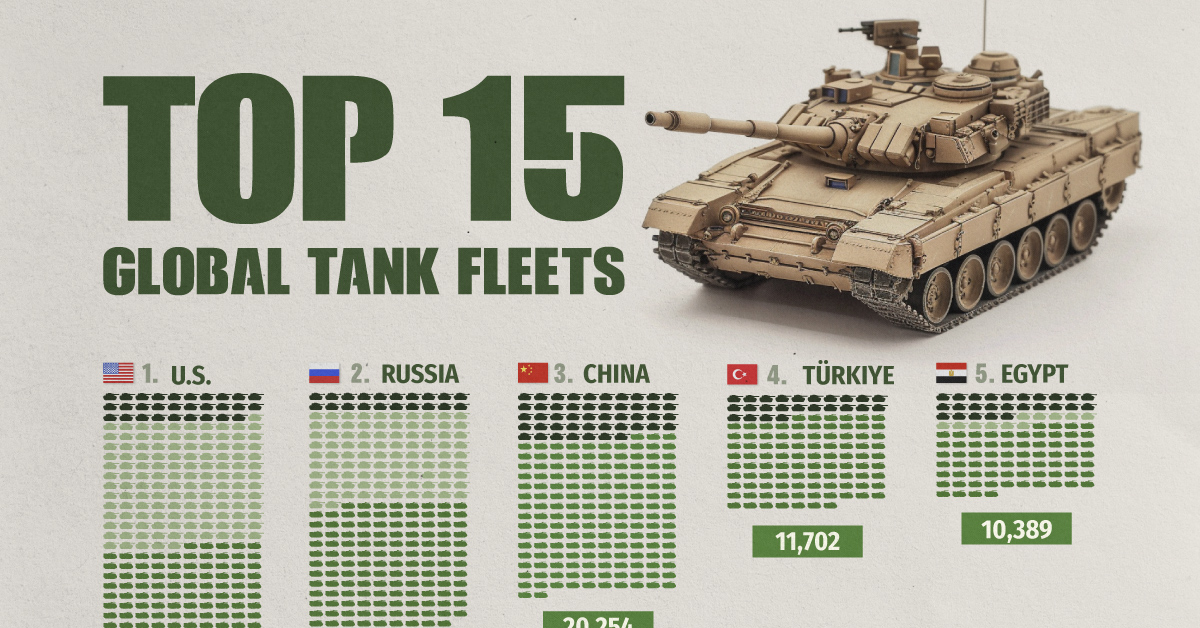
The Top 15 Global Tank Fleets
This was originally posted on our Voronoi app. Download the app for free on iOS or Android and discover incredible data-driven charts from a variety of trusted sources.
Heavily armed and armored, the modern tank is a versatile and mobile weapons platform, and a critical piece of contemporary warfare.
This visualization shows the top 15 global tank fleets, using data from the 2024 Military Balance report from the International Institute for Strategic Studies (IISS).
Let’s take an in-depth look at the top three fleets:
1. United States
As the world’s pre-eminent military power, it’s perhaps no surprise that the United States also has the largest tank fleet, by a wide margin.
In total, they have just over 45,000 armored fighting vehicles in operation, along with 2,640 main battle tanks (MBTs), and 12,800 vehicles in storage, of which 2,000 are main battle tanks.
| Category | Vehicles | Global rank |
|---|---|---|
| Main battle tanks | 2,640 | 4 |
| Armored reconnaissance | 1,745 | 1 |
| Infantry fighting vehicles | 3,262 | 3 |
| Armored personnel carriers | 10,644 | 1 |
| Amphibious assault vehicles | 1,401 | 1 |
| Armored utility vehicles | 28,445 | 1 |
| Storage | 12,800 | 1 |
| Total | 60,937 | 1 |
The U.S. is internalizing the lessons from the ongoing invasion of Ukraine, where Western-supplied anti-tank weapons and massed Ukrainian artillery have been cutting Russian tanks to pieces. As a result, the U.S. recently canceled an upgrade of the M1 Abrams in favor of a more ambitious upgrade.
Meanwhile, the U.S. is nervously eyeing a more confident China and a potential clash over Taiwan, where air and naval forces will be critical. However, a recent war game showed that Taiwanese mechanized ground forces, kitted out with American-made tanks and armored fighting vehicles, were critical in keeping the island autonomous.
2. Russia
According to Oryx, a Dutch open-source intelligence defense website, at time of writing, Russia has lost almost 2,800 main battle tanks since invading Ukraine. Considering that in the 2022 edition of the Military Balance, Russia was estimated to have 2,927 MBTs in operation, those are some hefty losses.
Russia has been able to maintain about 2,000 MBTs in the field, in part, by increasing domestic production. Many defense plants have been taken over by state-owned Rostec and now operate around the clock. Russia is also now spending a full third of their budget on defense, equivalent to about 7.5% of GDP.
At the same time, they’ve also been drawing down their Soviet-era stockpiles, which are modernized before being sent to the front. Just how long they can keep this up is an open question; their stockpiles are large, but not limitless. Here is what their storage levels look like:
| Category | 2023 | 2024 | YOY change |
|---|---|---|---|
| Main battle tanks | 5,000 | 4,000 | -20.0% |
| Armored reconnaissance | 1,000 | 100 | -90.0% |
| Infantry fighting vehicles | 4,000 | 2,800 | -30.0% |
| Armored personnel carriers | 6,000 | 2,300 | -61.7% |
| Total | 16,000 | 9,200 | -42.5% |
3. China
China holds the third overall spot and top place globally for the number of main battle tanks in operation. Untypically, the People’s Liberation Army has no armored vehicles in storage, which perhaps isn’t surprising when you consider that China has been rapidly modernizing its military and that stockpiles usually contain older models.
China also has one of the world’s largest fleets of armored fighting vehicles, second only to the United States. Breaking down that headline number, we can also see that they have the largest number of light tanks, wheeled guns, and infantry fighting vehicles.
| Category | Vehicles | Global rank |
|---|---|---|
| Main battle tanks | 4,700 | 1 |
| Light tanks | 1,330 | 1 |
| Wheeled guns | 1,250 | 1 |
| Infantry fighting vehicles | 8,200 | 1 |
| Armored personnel carriers | 3,604 | 5 |
| Airborne combat vehicles | 180 | 2 |
| Amphibious assault vehicles | 990 | 2 |
| Total | 20,254 | 3 |
This is equipment that would be integral if China were to make an attempt to reunify Taiwan with the mainland by force, where lightly armored mechanized units need to move with speed to occupy the island before Western allies can enter the fray. It’s worth noting that China also has one of the world’s largest fleets of amphibious assault vehicles.
End of the Tank?
Many commentators at the outset of Russia’s invasion of Ukraine, were quick to predict the end of the tank, however, to paraphrase Mark Twain, reports of the tank’s demise are greatly exaggerated.
With the U.S. and China both developing remote and autonomous armored vehicles, tanks could be quite different in the future, but there is nothing else that matches them for firepower, mobility, and survivability on the modern battlefield today.

-

 Markets1 week ago
Ranked: The Largest U.S. Corporations by Number of Employees
-

 Green3 weeks ago
Ranked: Top Countries by Total Forest Loss Since 2001
-

 Money2 weeks ago
Where Does One U.S. Tax Dollar Go?
-

 Automotive2 weeks ago
Almost Every EV Stock is Down After Q1 2024
-

 AI2 weeks ago
The Stock Performance of U.S. Chipmakers So Far in 2024
-

 Markets2 weeks ago
Charted: Big Four Market Share by S&P 500 Audits
-

 Real Estate2 weeks ago
Ranked: The Most Valuable Housing Markets in America
-

 Money2 weeks ago
Which States Have the Highest Minimum Wage in America?