Technology
Visualizing the Jobs Lost to Automation
Visualizing the Jobs Lost to Automation
The employment landscape of the future will look very different than it does today.
While we’ve charted the automation potential of U.S. jobs before, today’s graphic from Henrik Lindberg perhaps tells the story more succinctly.
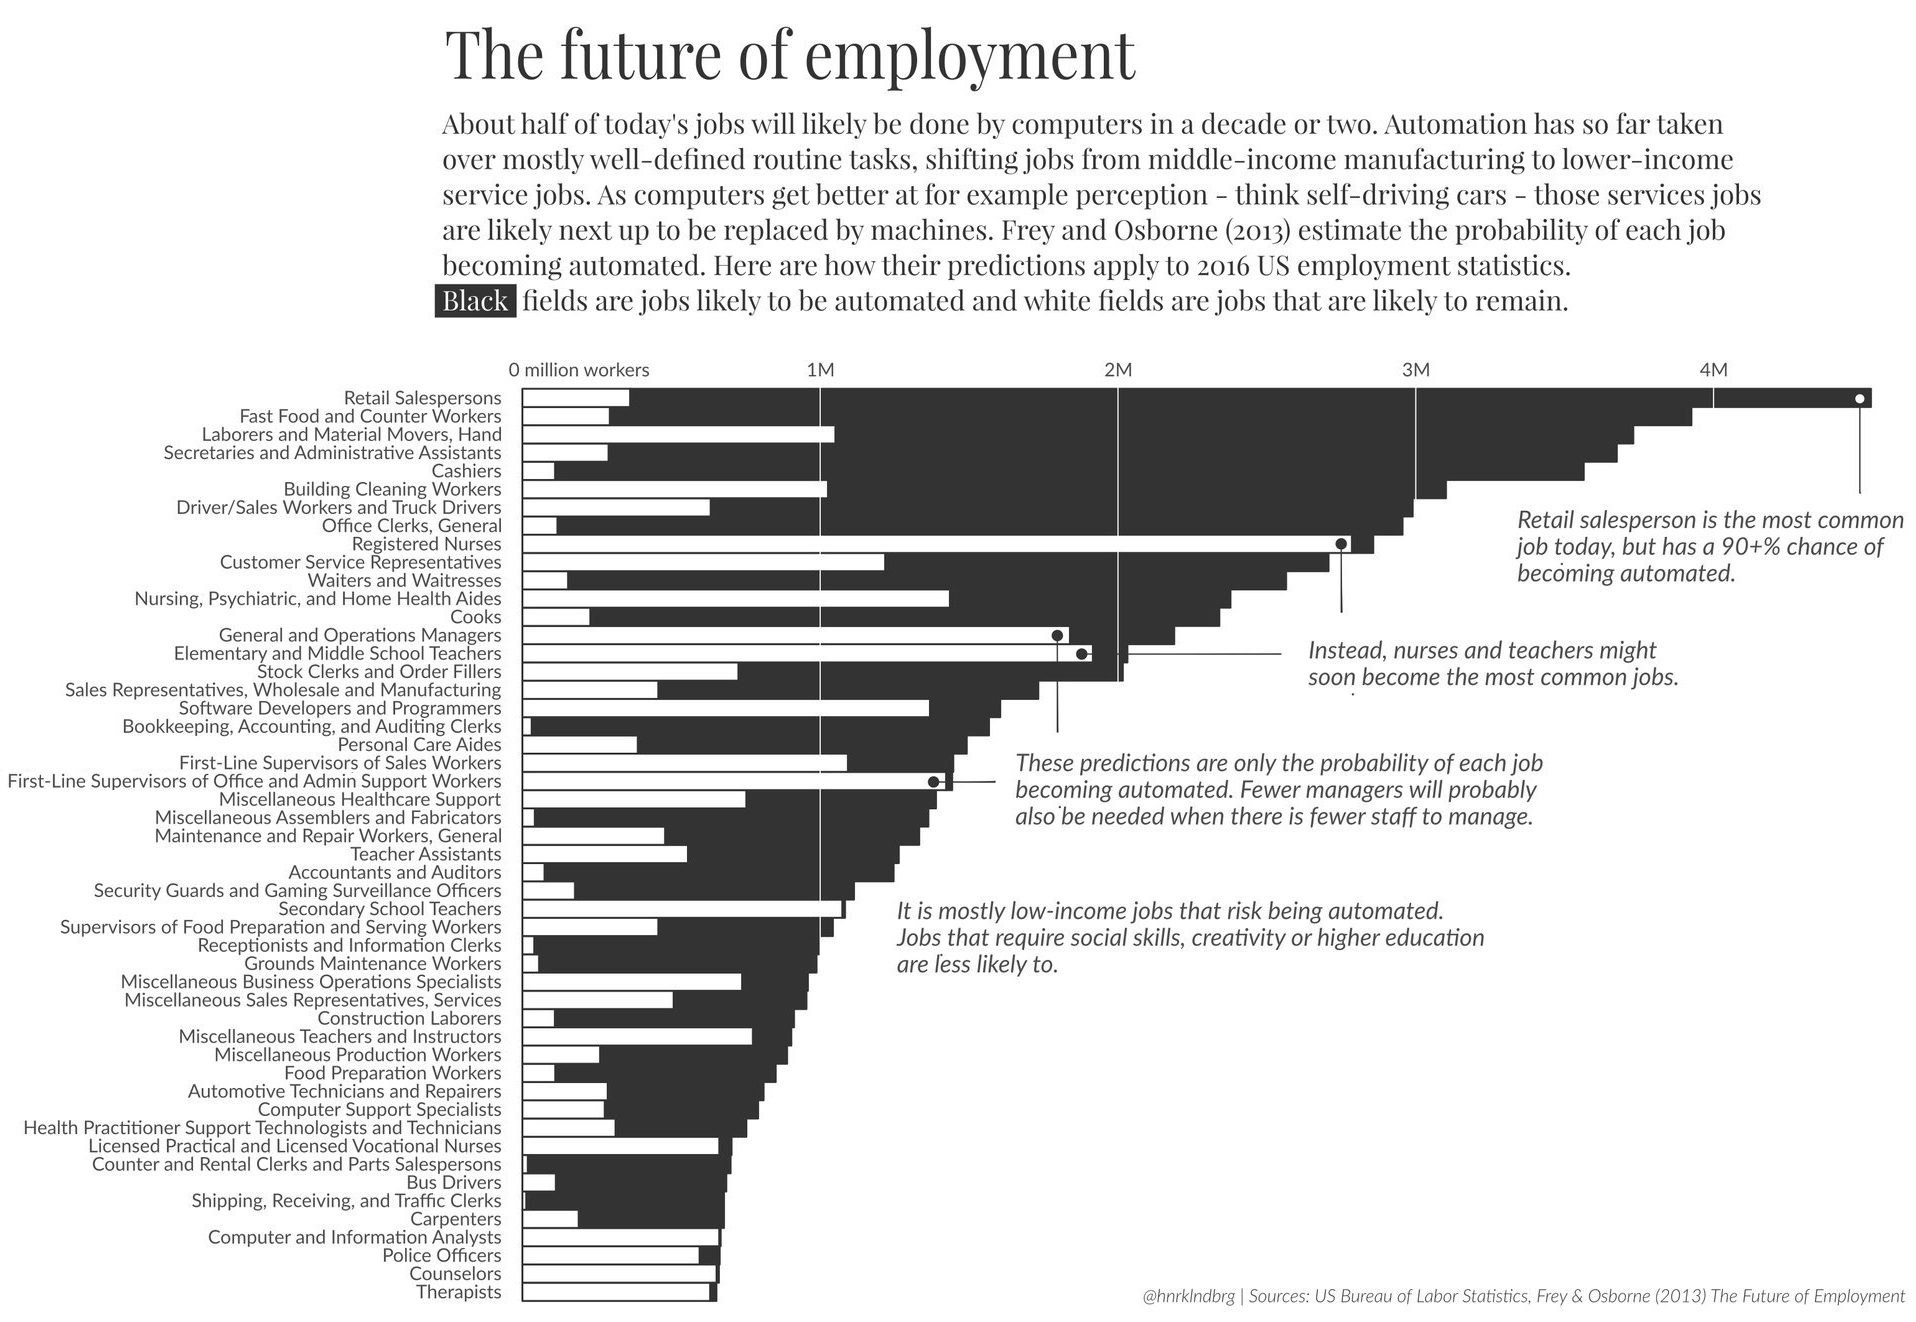
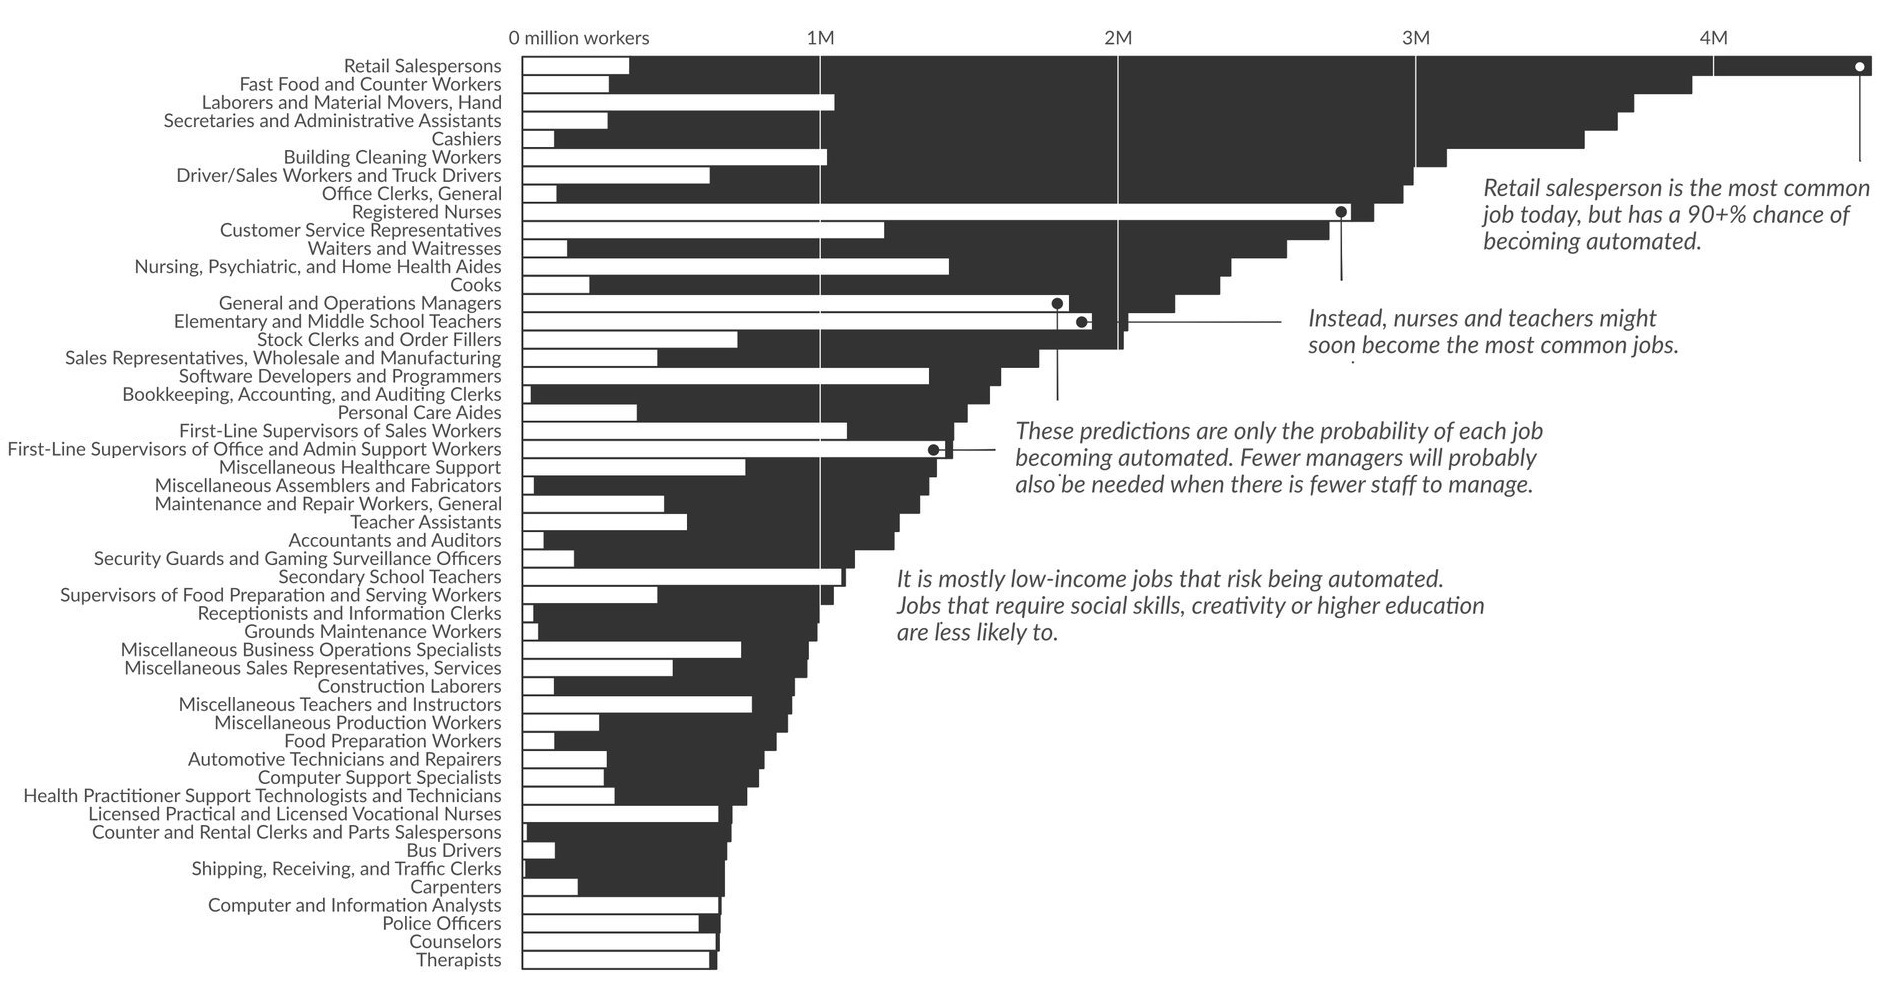
In plain black and white, it shows the jobs that exist today in contrast to the jobs that are expected to disappear as a result of automation in the workplace. Though, technically speaking, it is applying the probabilities of the widely-cited Frey & Osborne (2013) study to U.S. jobs as of 2016 to give an expected value to each job title.
A Different Landscape
In the near-future, many of today’s most common jobs may be changed profoundly. People working as retail salespersons, cashiers, fast food counter workers, and truck drivers will likely see opportunities in those fields dry up as automation takes place.
At the same time, jobs such as those in teaching and nursing are expected to stand the test of time, as they require empathy, creativity, and a human touch not yet available through machines. In the coming decades, it’s possible that these could even be professions that employ the most people overall.
Casualties of the Fall?
In the vastly different employment landscape of the future, the worry is that low income workers will have fewer opportunities available to them as technology comes into play.
The good news? Historically this has not been true. As an example, nearly 500 years ago, Queen Elizabeth I had a similar fear when she denied a patent for an automated knitting machine. The thought was that the machine would kill jobs, though eventually factories and companies adopted similar technologies anyways. With the lower prices, higher demand for knitted goods, and more capital for investment, jobs for factory weavers actually quadrupled in the coming years.
As we’ve seen over time, while machines destroy jobs, they also often create new ones.
Composition of U.S. Job Market over the Last 150+ Years
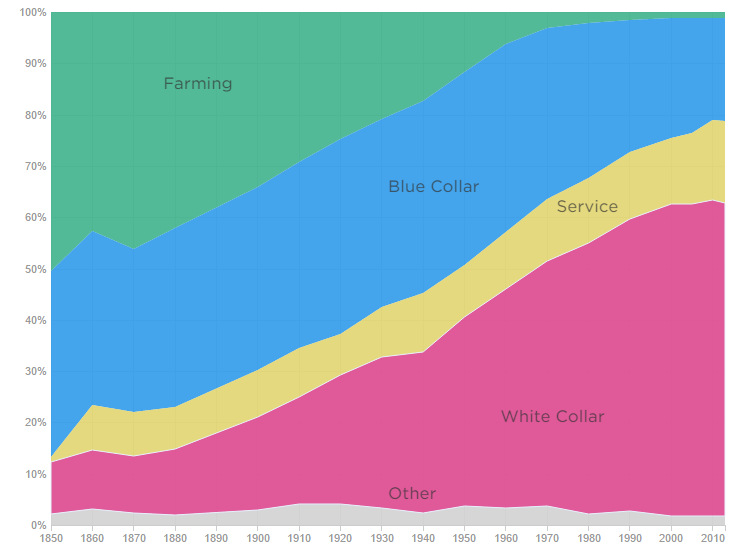
The bad news? It is now clear that agricultural jobs of the early 20th century were replaced with the white collar jobs of today. However, it is much more difficult to forecast out how some of the jobs of the future will be created, especially for low income workers.
The knitting example above certainly applies in some situations – but in others, it’s hard to say what will happen. For example, with millions of unemployed long-haul truck drivers, what roles will these people be taking in the future job market?
Even with costs of transportation and logistics going down, increased demand, and more capital to invest, it seems that there’s going to be a lengthy period of time where many of these people will have trouble finding work.
Do they join the company to help manage the many more trucks that are self-driving? It’s unlikely, and that is the part of the optimism about automation and future jobs that is the hardest to reconcile.


Technology
Countries With the Highest Rates of Crypto Ownership
While the U.S. is a major market for cryptocurrencies, two countries surpass it in terms of their rates of crypto ownership.


Countries With the Highest Rates of Crypto Ownership
This was originally posted on our Voronoi app. Download the app for free on iOS or Android and discover incredible data-driven charts from a variety of trusted sources.
This graphic ranks the top 10 countries by their rate of cryptocurrency ownership, which is the percentage of the population that owns crypto. These figures come from crypto payment gateway, Triple-A, and are as of 2023.
Data and Highlights
The table below lists the rates of crypto ownership in the top 10 countries, as well as the number of people this amounts to.
| Country | % of Population Who Own Crypto | # of Crypto Owners |
|---|---|---|
| 🇦🇪 United Arab Emirates | 30.4 | 3M |
| 🇻🇳 Vietnam | 21.2 | 21M |
| 🇺🇸 U.S. | 15.6 | 53M |
| 🇮🇷 Iran | 13.5 | 12M |
| 🇵🇭 Philippines | 13.4 | 16M |
| 🇧🇷 Brazil | 12 | 26M |
| 🇸🇦 Saudi Arabia | 11.4 | 4M |
| 🇸🇬 Singapore | 11.1 | 665K |
| 🇺🇦 Ukraine | 10.6 | 4M |
| 🇻🇪 Venezuela | 10.3 | 3M |
Note that if we were to rank countries based on their actual number of crypto owners, India would rank first at 93 million people, China would rank second at 59 million people, and the U.S. would rank third at 52 million people.
The UAE Takes the Top Spot
The United Arab Emirates (UAE) boasts the highest rates of crypto ownership globally. The country’s government is considered to be very crypto friendly, as described in Henley & Partners’ Crypto Wealth Report 2023:
In the UAE, the Financial Services Regulatory Authority (FSRA-ADGM) was the first to provide rules and regulations regarding cryptocurrency purchasing and selling. The Emirates are generally very open to new technologies and have proposed zero taxes for crypto owners and businesses.
Vietnam leads Southeast Asia
According to the Crypto Council for Innovation, cryptocurrency holdings in Vietnam are also untaxed, making them an attractive asset.
Another reason for Vietnam’s high rates of ownership could be its large unbanked population (people without access to financial services). Cryptocurrencies may provide an alternative means of accessing these services without relying on traditional banks.
Learn More About Crypto From Visual Capitalist
If you enjoyed this post, be sure to check out The World’s Largest Corporate Holders of Bitcoin, which ranks the top 12 publicly traded companies by their Bitcoin holdings.

-

 Markets6 days ago
Visualized: Interest Rate Forecasts for Advanced Economies
-

 Markets2 weeks ago
Economic Growth Forecasts for G7 and BRICS Countries in 2024
-

 Wealth2 weeks ago
Charted: Which City Has the Most Billionaires in 2024?
-

 Technology2 weeks ago
All of the Grants Given by the U.S. CHIPS Act
-

 Green2 weeks ago
The Carbon Footprint of Major Travel Methods
-

 United States1 week ago
Visualizing the Most Common Pets in the U.S.
-

 Culture1 week ago
The World’s Top Media Franchises by All-Time Revenue
-

 voronoi1 week ago
Best Visualizations of April on the Voronoi App