Technology
Predicting the Future of Media and Entertainment
View a high resolution version of this graphic
Visualizing the Future of Media and Entertainment
View the high resolution version of today’s graphic by clicking here.
Over your lifetime, the consumption of media and entertainment has already changed drastically.
For Boomers and Gen Xers, the shift has been earth-shattering. Both generations will remember a time before mainstream computing when TV was dominated by the Big Three TV networks (NBC, ABC, and CBS), and newspapers and magazines were the main way to stay in touch with what was happening.
Even millennials have seen fundamental shifts in consumption of media. After all, they experienced the rise of social media, online news, streaming, and digital video firsthand. Many of them will remember their college getting access to Facebook for the first time, the death of Napster, and the funny sounds their 28.8k modem made as it struggled to successfully download a single image file.
The modern landscape of media is very different than it was back then – and the coming years will see even more prolific changes.
The Future of Media and Entertainment
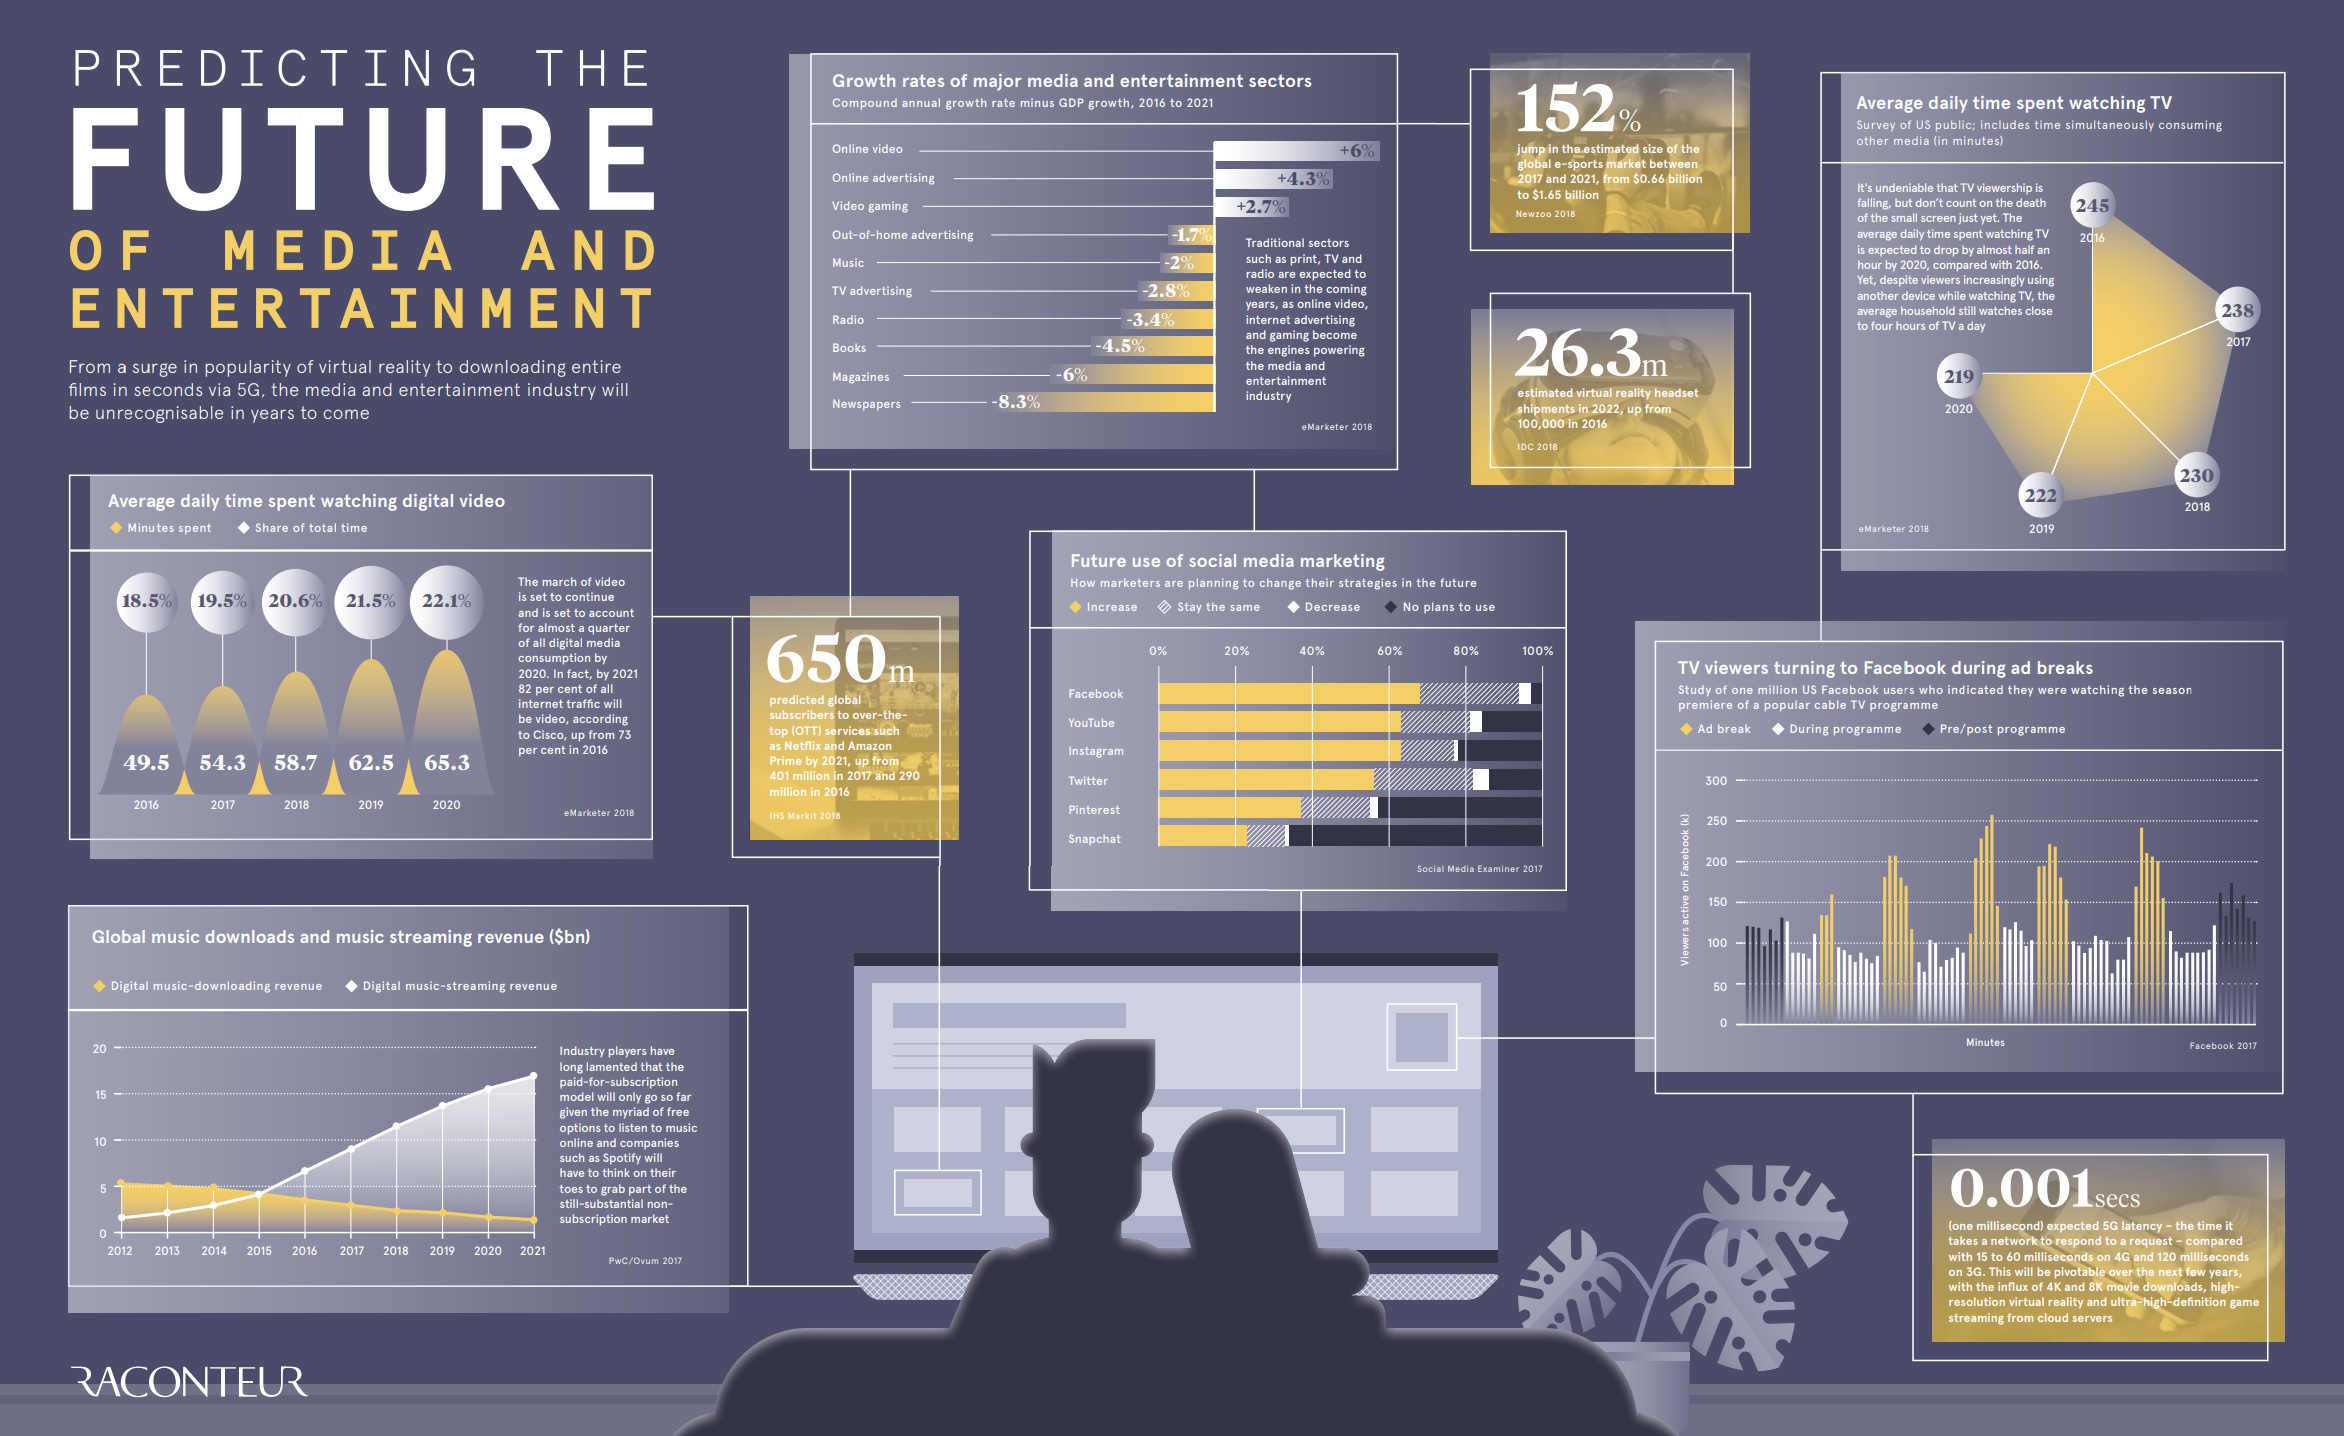
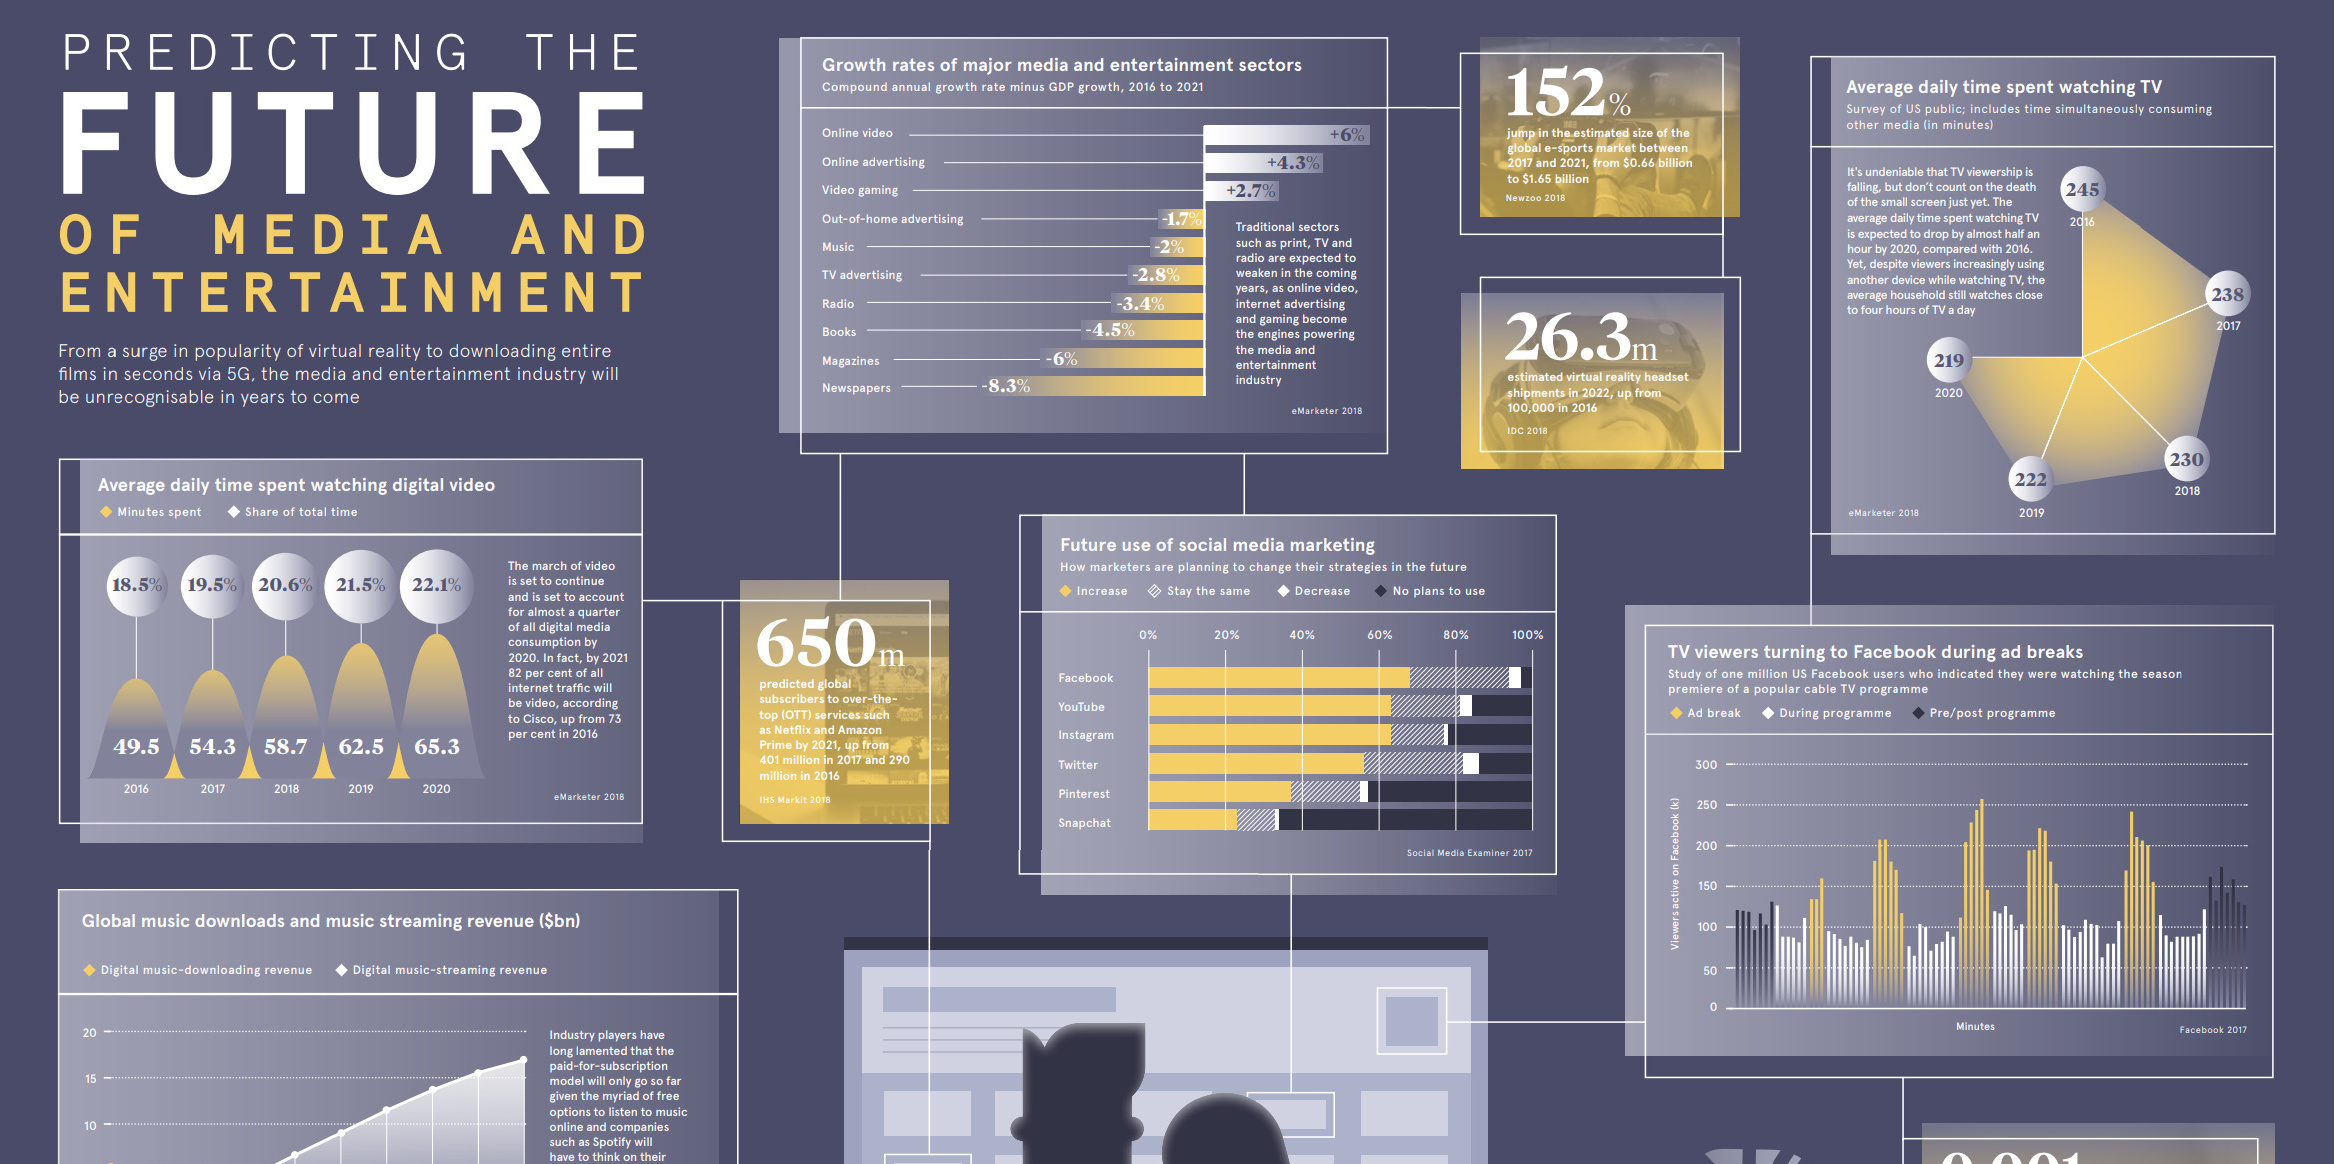
Today’s infographic comes to us from Raconteur, and it showcases multiple sets of data that help to illustrate the direction that media is heading. This includes the growth rates of various media and entertainment sectors, TV viewing trends, and social media use.
Here are some of the key trends that we found to be compelling:
Annualized Media Sector Growth (Minus GDP Growth) from 2016-2021
| Media sector | Annual Growth (minus GDP growth) |
|---|---|
| Online Video | 6.0% |
| Online Advertising | 4.3% |
| Video Gaming | 2.7% |
| Out-of home Ads | -1.7% |
| Music | -2.0% |
| TV Advertising | -2.8% |
| Radio | -3.4% |
| Books | -4.5% |
| Magazines | -6.0% |
| Newspapers | -8.3% |
Online video (6.0%), online ads (4.3%), and video gaming (2.7%) are the only sectors growing at a rate faster than GDP growth.
But while digital video use is growing, it’s not going to takeover TV anytime soon:
Daily Minutes Watching TV vs. Digital Video
| Year | TV (Minutes watched) | Digital Video (Minutes Watched) |
|---|---|---|
| 2016 | 245 | 49.5 |
| 2017 | 238 | 54.3 |
| 2018 | 230 | 58.7 |
| 2019 | 222 | 62.5 |
| 2020 | 219 | 65.3 |
Lastly, here are some figures on the future of media and entertainment that are particularly interesting:
- By 2021, Cisco says that 82% of all internet traffic will stem from digital video
- There will be 26.3 million VR headsets shipped in 2022, up from 100,000 in 2016
- The eSports market will jump 152% in size by 2021
- By 2021, there will be 650 million subscribers to services like Amazon Prime or Netflix
- 5G latency is expected to be 0.001 seconds, which is 15-60x faster than 4G
It’s fair to say that in another decade, media and entertainment will be much less recognizable than what it looks like today.


Technology
All of the Grants Given by the U.S. CHIPS Act
Intel, TSMC, and more have received billions in subsidies from the U.S. CHIPS Act in 2024.


All of the Grants Given by the U.S. CHIPS Act
This was originally posted on our Voronoi app. Download the app for free on iOS or Android and discover incredible data-driven charts from a variety of trusted sources.
This visualization shows which companies are receiving grants from the U.S. CHIPS Act, as of April 25, 2024. The CHIPS Act is a federal statute signed into law by President Joe Biden that authorizes $280 billion in new funding to boost domestic research and manufacturing of semiconductors.
The grant amounts visualized in this graphic are intended to accelerate the production of semiconductor fabrication plants (fabs) across the United States.
Data and Company Highlights
The figures we used to create this graphic were collected from a variety of public news sources. The Semiconductor Industry Association (SIA) also maintains a tracker for CHIPS Act recipients, though at the time of writing it does not have the latest details for Micron.
| Company | Federal Grant Amount | Anticipated Investment From Company |
|---|---|---|
| 🇺🇸 Intel | $8,500,000,000 | $100,000,000,000 |
| 🇹🇼 TSMC | $6,600,000,000 | $65,000,000,000 |
| 🇰🇷 Samsung | $6,400,000,000 | $45,000,000,000 |
| 🇺🇸 Micron | $6,100,000,000 | $50,000,000,000 |
| 🇺🇸 GlobalFoundries | $1,500,000,000 | $12,000,000,000 |
| 🇺🇸 Microchip | $162,000,000 | N/A |
| 🇬🇧 BAE Systems | $35,000,000 | N/A |
BAE Systems was not included in the graphic due to size limitations
Intel’s Massive Plans
Intel is receiving the largest share of the pie, with $8.5 billion in grants (plus an additional $11 billion in government loans). This grant accounts for 22% of the CHIPS Act’s total subsidies for chip production.
From Intel’s side, the company is expected to invest $100 billion to construct new fabs in Arizona and Ohio, while modernizing and/or expanding existing fabs in Oregon and New Mexico. Intel could also claim another $25 billion in credits through the U.S. Treasury Department’s Investment Tax Credit.
TSMC Expands its U.S. Presence
TSMC, the world’s largest semiconductor foundry company, is receiving a hefty $6.6 billion to construct a new chip plant with three fabs in Arizona. The Taiwanese chipmaker is expected to invest $65 billion into the project.
The plant’s first fab will be up and running in the first half of 2025, leveraging 4 nm (nanometer) technology. According to TrendForce, the other fabs will produce chips on more advanced 3 nm and 2 nm processes.
The Latest Grant Goes to Micron
Micron, the only U.S.-based manufacturer of memory chips, is set to receive $6.1 billion in grants to support its plans of investing $50 billion through 2030. This investment will be used to construct new fabs in Idaho and New York.

-

 Wealth6 days ago
Charted: Which City Has the Most Billionaires in 2024?
-

 Mining2 weeks ago
Gold vs. S&P 500: Which Has Grown More Over Five Years?
-

 Uranium2 weeks ago
The World’s Biggest Nuclear Energy Producers
-

 Education2 weeks ago
How Hard Is It to Get Into an Ivy League School?
-

 Debt2 weeks ago
How Debt-to-GDP Ratios Have Changed Since 2000
-

 Sports2 weeks ago
The Highest Earning Athletes in Seven Professional Sports
-

 Science2 weeks ago
Visualizing the Average Lifespans of Mammals
-

 Brands1 week ago
How Tech Logos Have Evolved Over Time