Currency
A Timeline of Every Major Disruption in Payments

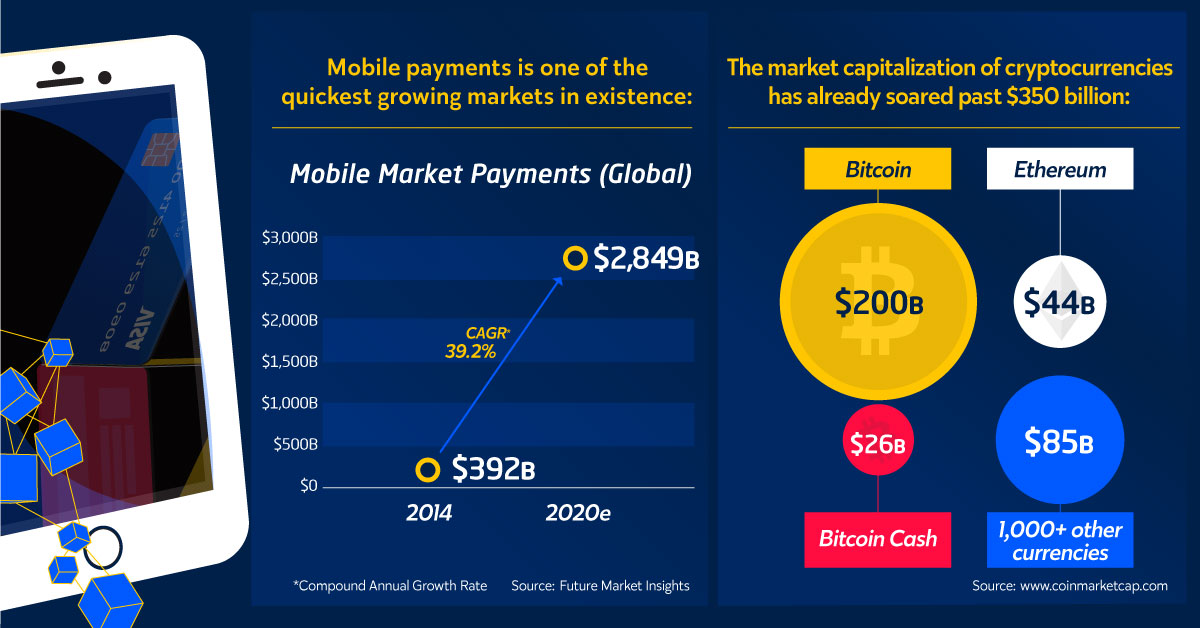
The current payments landscape is moving at a blistering pace.
Mobile payments, for example, is a market growing at a 39.2% annual clip, and it will be worth nearly $3 trillion by 2020. At the same time, it’s almost impossible to keep up with the growth in the blockchain world. Every day, new technical problems are being solved, coin market caps are hitting new highs, and Bitcoin is dominating the news cycle.
But, payments hasn’t always been this fast-moving or exciting. In fact, right now is an anomalous moment in the sector – and we’re actually witnessing a rare intersection of multiple disruptive technologies coming to age at the same time.
A Timeline of Payment Disruptions
Today’s infographic comes from Glance Technologies, and it shows a historical timeline of the major disruptions that have occurred in payments, ranging from the Chinese invention of paper money to the birth of Paypal.
It keys in on the new wealth created by these incredible technological advancements – and it also highlights the origins behind many of the crucial pieces of today’s payments landscape.
It took roughly 1,100 years to go from paper money to plastic, 50 years to go from plastic to digital, and just 10 years to go from digital to mobile.
What fundamental change in payments is the next big one that will be visible across all levels of society?
The Next Big Shift
It may be too early to tell for sure what the next society-wide shift in payments will be, but there are definitely some obvious candidates.
Blockchain
Even with the precipitous rise of Bitcoin and its incredible journey to $10,000 and beyond, it’s still easy to underestimate the real possibilities in a decentralized, blockchain-based payments world. Various types of payments will be automated with smart contracts, and many of the world’s largest banks are already deep in experimentation with digital currencies.
In an ultra rosy scenario, it’s even imaginable to say that fiat currency may one day be obsolete. There are still many challenges to overcome, of course, but the blockchain could soon be ubiquitous in everyday payments at a societal level.
100% Cash-Free
Just like the blockchain, the idea of going cashless already has growing adoption – however, it is not yet something that dominates all facets of payments on a societal level. Right now, in the United States, just 38% of people said they would be willing to go completely cash-free.
With the market for mobile payments increasing at a 39.2% CAGR, a fully cash-free world might not be that far off, though.
Other
While the two above trends are the most obvious, there are some dark horses out there. For example, biometrics is one that could change how payments are verified, adding a new layer of security to transactions. Instead of using a smartphone, plastic, or cash, could you be paying for every purchase with a simple fingerprint soon?
Regardless of which of these is the next ubiquitous technology, the next five years of the payments space will certainly be exciting to watch.


Money
Visualizing All of the U.S. Currency in Circulation
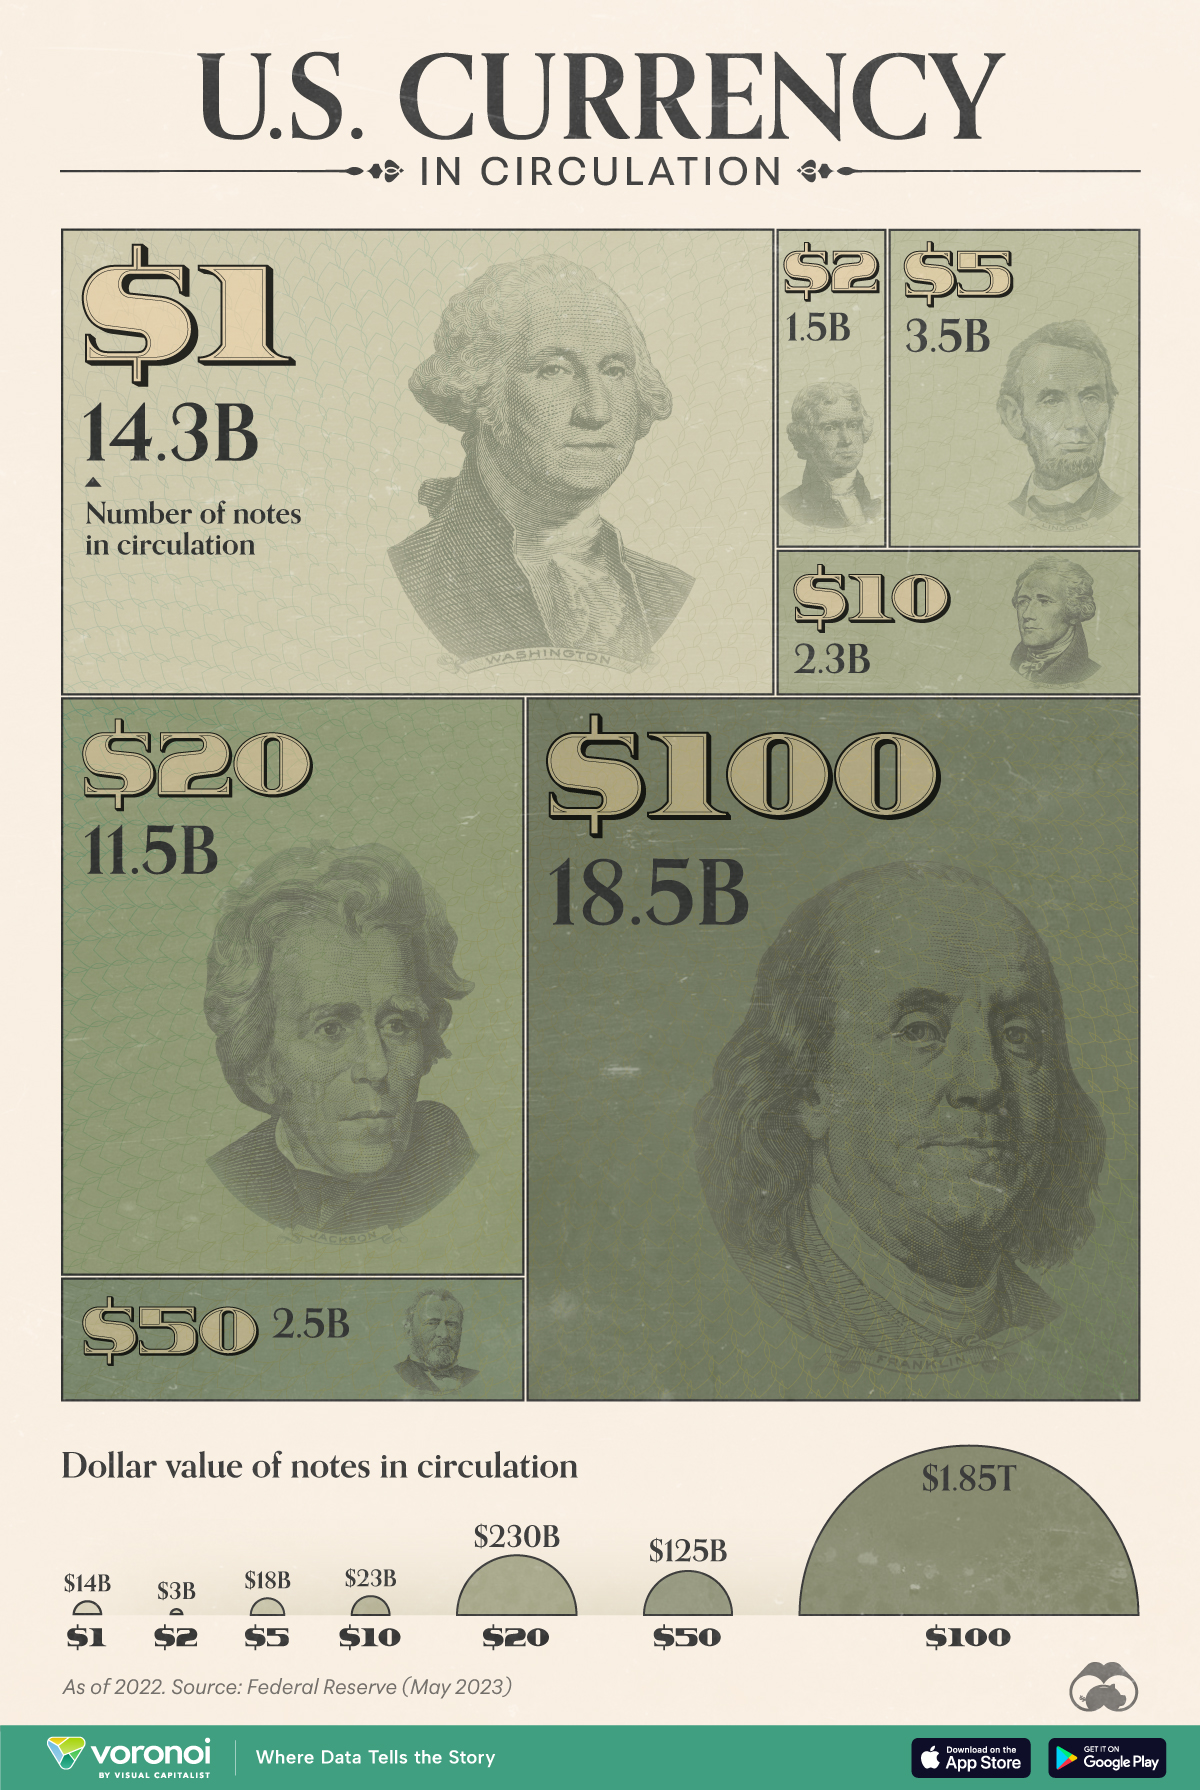
This graphic illustrates the amount of U.S. currency in circulation globally, by denomination, based on data from the Federal Reserve.
Visualizing All of the U.S. Currency in Circulation
This was originally posted on our Voronoi app. Download the app for free on iOS or Android and discover incredible data-driven charts from a variety of trusted sources.
Have you ever wondered how much U.S. currency is in circulation?
Every year, the U.S. Federal Reserve submits a print order for U.S. currency to the Treasury Department’s Bureau of Engraving and Printing (BEP). The BEP will then print billions of notes in various denominations, from $1 bills to $100 bills.
In this graphic, we’ve used the latest Federal Reserve data to visualize the approximate number of bills for each denomination globally, as of Dec. 31, 2022.
Breakdown of U.S. Currency in Circulation
The following table lists all of the data we used to create the visualization above. Note that value figures were rounded for simplicity.
| Type of Bill | Number of notes in circulation (billions) | Value ($B) |
|---|---|---|
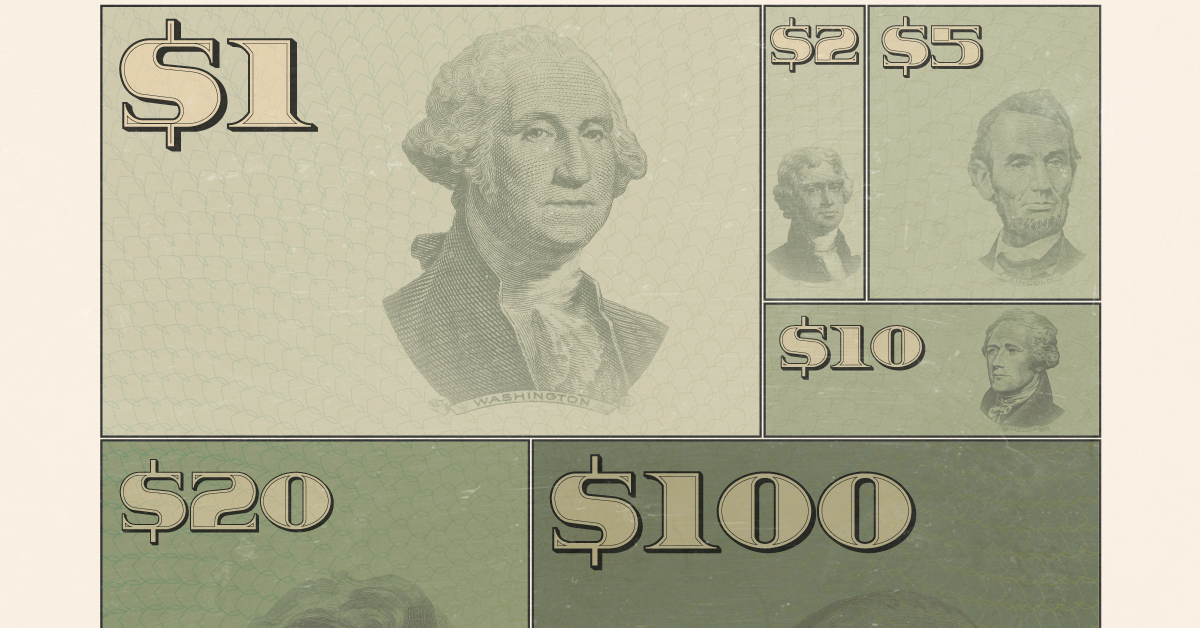
| $1 | 14.3 | $14B |
| $2 | 1.5 | $3B |
| $5 | 3.5 | $18B |
| $10 | 2.3 | $23B |
| $20 | 11.5 | $230B |
| $50 | 2.5 | $125B |
| $100 | 18.5 | $1,850B |
| $500-10,000* | 0.0004 | n/a |
*$500-10,000 bills are listed as a range, and a total circulation of 0.0004 billion. Not included in graphic.
From these numbers, we can see that $100 bills are the most common bill in circulation, even ahead of $1 bills.
One reason for this is $100 bills have a longer lifespan than smaller denominations, due to people using $100 bills less often for transactions. Some businesses may also decline $100 bills as payment.
Based on 2018 estimates from the Federal Reserve, a $100 bill has a lifespan of over 20 years, which is significantly higher than $1 bills (7 years) and $5 bills (5 years).
If you’re interested in more visualizations on the U.S. dollar, consider this animated chart which shows how the dollar overtook the British pound as the world’s most prominent reserve currency.

-

 Debt1 week ago
How Debt-to-GDP Ratios Have Changed Since 2000
-

 Markets2 weeks ago
Ranked: The World’s Top Flight Routes, by Revenue
-

 Countries2 weeks ago
Population Projections: The World’s 6 Largest Countries in 2075
-

 Markets2 weeks ago
The Top 10 States by Real GDP Growth in 2023
-

 Demographics2 weeks ago
The Smallest Gender Wage Gaps in OECD Countries
-

 United States2 weeks ago
Where U.S. Inflation Hit the Hardest in March 2024
-

 Green2 weeks ago
Top Countries By Forest Growth Since 2001
-

 United States2 weeks ago
Ranked: The Largest U.S. Corporations by Number of Employees