Energy
The Lithium Revolution
The Lithium Revolution
How the shift to clean energy has opened a window of opportunity for energy metals.
“The Lithium Revolution” infographic presented by: Dajin Resources
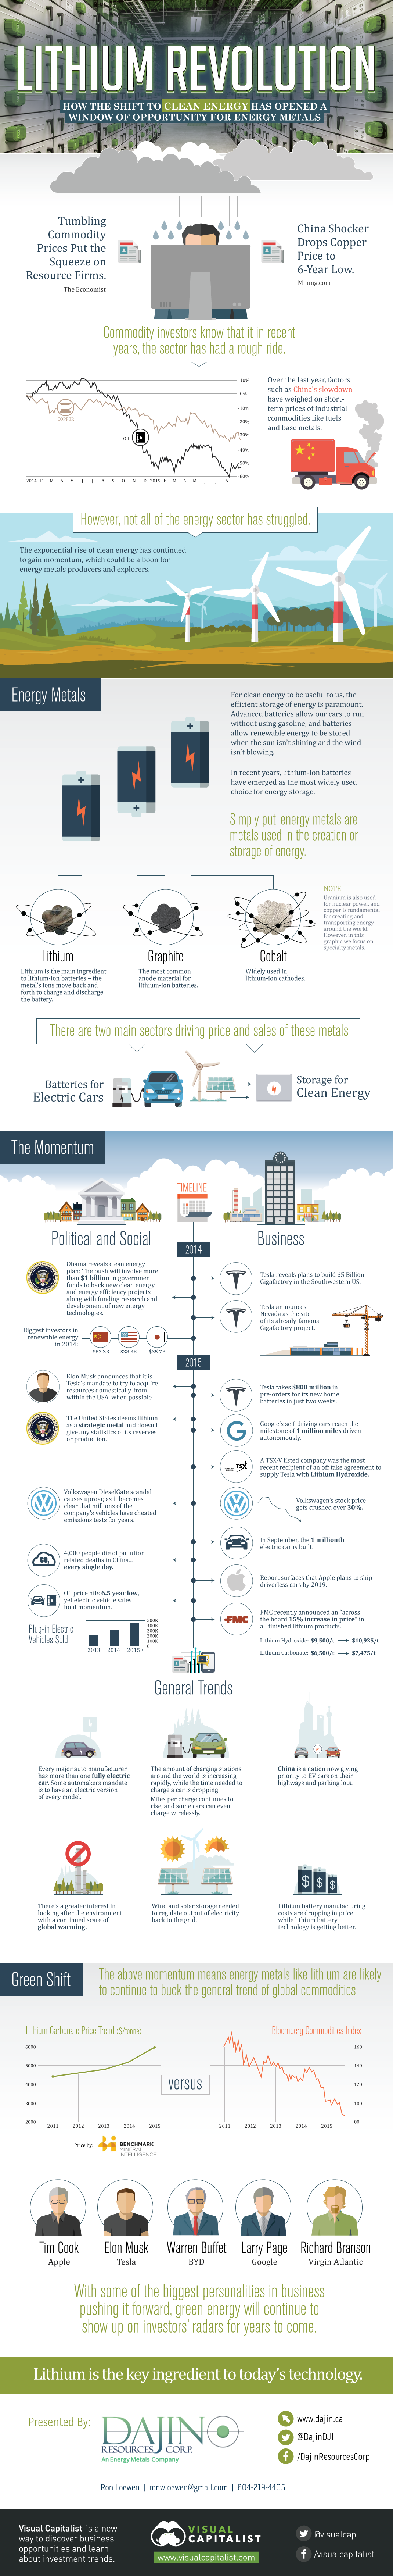
Commodity investors know that it in recent years, the sector has had a rough ride. Recently, factors such as China’s slowdown have weighed on short-term prices of industrial commodities like fuels and base metals.
However, not all of the energy sector has struggled. The rise of clean energy has continued to gain momentum, which could be a boon for energy metals producers and explorers.
Energy Metals
Simply put, energy metals are metals used in the creation or storage of energy. Here are some examples of energy metals needed to make lithium-ion batteries, which are the storage mechanism of choice for many green energy producers:
Lithium: Lithium is the main ingredient to lithium-ion batteries – the metal’s ions move back and forth to charge and discharge the battery.
Cobalt: Widely used in lithium-ion cathodes
Graphite: The most common anode material for lithium-ion batteries.
Note: Uranium is also used for nuclear power, and copper is fundamental for creating and transporting energy around the world. However, in this infographic we focus on specialty metals.
Electric cars and energy storage for renewable sources have been driving the increases in price and demand for these sectors. Let’s take a look at the specific momentum that has been growing since 2014.
The Momentum
Political and social:
2014
- Obama reveals clean energy plan: The push will involve more than $1 billion in government funds to back new clean energy and energy efficiency projects along with funding research and development of new energy technologies.
- Who were the biggest investors in renewable energy in 2014?
China ($83.3 billion), USA ($38.3 billion), and Japan ($35.7 billion)
2015
- Volkswagen DieselGate scandal causes uproar, as it becomes clear that millions of the company’s vehicles have cheated emissions tests for years
- Elon Musk announces a mandate for Tesla Motors to acquire raw materials from the USA when possible.
- 4,000 people die, each day, of pollution related deaths in China alone.
- The United States deems lithium as a strategic metal and doesn’t give any statistics of its reserves or production.
Business:
2014
- Tesla reveals plans to build $5 Billion Gigafactory in the Southwestern US.
- Tesla announces Nevada as the site of its already-famous Gigafactory project.
2015
- The 1 millionth electric car is built in September 2015.
- Report surfaces that Apple plans to ship driverless cars by 2019.
- Google’s self-driving cars reach the milestone of 1 million miles driven autonomously.
- Tesla takes $800 million in orders for its new home batteries in just two weeks.
- A TSX-V traded company was the most recent recipient of an off take agreement to supply Tesla with Lithium Hydroxide.
- Volkswagen’s stock price gets crushed over 30% in the aftermath of DieselGate.
- FMC recently announced an “across the board 15% increase in price” in all finished lithium products. Lithium Hydroxide rose from $9,500 per ton, up to $10,870. Lithium Carbonate from $6,500 per ton up to $7,475 USD.
General Trends:
- Charging stations have increased rapidly around the world.
- Every major auto manufacture has more than one fully electric car. Some automakers mandate is to have an electric version of every model.
- The oil price has hit a 6.5 year low, yet electric vehicle sales have held momentum.
- Lithium battery manufacturing costs are dropping in price while lithium battery technology is getting better.
- New technology is decreasing the charge time for electric cars. Meanwhile, “miles per charge” is rising, and some cars can even recharge wirelessly.
- There’s a greater interest in looking after the environment with a continued scare of global warming.
- Wind and solar storage needed to regulate output of electricity back to the grid.
- China is a nation now giving priority to EV cars on their highways and parking lots.
Green Shift
The above momentum means energy metals like lithium could continue to buck the general trend of global commodities. So far, the price of lithium has increased steadily since 2011.


Energy
Mapped: The Age of Energy Projects in Interconnection Queues, by State
This map shows how many energy projects are in interconnection queues by state and how long these projects have been queued up, on average.


Age of Energy Projects in Interconnection Queues, by State
This was originally posted on our Voronoi app. Download the app for free on iOS or Android and discover incredible data-driven charts from a variety of trusted sources.
By the end of 2023, more than 11,000 energy projects were in interconnection queues in the United States, waiting for a green-light from regional grid operators to proceed with construction.
This map, created in partnership with the National Public Utilities Council, maps out the average age of active energy projects in interconnection queues by state, using data from Berkeley Lab.
Interconnection Queues, Explained
Interconnection queues are lists of energy projects that have made interconnection requests to their regional grid operators. Once submitted, these requests formally initiate the impact study process that each project goes through before grid connection, forming waiting lists for approval known as interconnection queues.
In recent years, both the number and generation capacity of queued projects have surged in the United States, along with the length of time spent in queue.
According to Berkeley Lab, the amount of generation capacity entering queues each year has risen by more than 550% from 2015 to 2023, with average queue duration rising from 3 years to 5 years the same period.
As a result of the growing backlog, a large proportion of projects ultimately withdraw from queues, leading to only 19% of applications reaching commercial operations.
The Backlog: Number of Projects and Average Wait Times
Of the 11,000 active projects in U.S. queues at the end of 2023, Texas, California, and Virginia had the most in queue; 1,208, 947, and 743, respectively.
When looking at the average ages of these projects, all three states hovered around the national average of 34 months (2.83 years), with Texas sporting 28 months, California 33, and Virginia 34.
Vermont, Minnesota, Wisconsin, and Florida, on the other hand, had the highest average queue durations; 54, 49, 47, and 46 months, respectively.
Average Queue Duration by Project Type
At the end of 2023, more than 95% of the generation capacity in active interconnection queues was for emission-free resources. The table below provides a breakdown.
| Project Type | Average Queue Duration (As of 12/31/2023) | Number of Projects in Queue |
|---|---|---|
| Wind | 40 months | 841 |
| Solar | 34 months | 4,506 |
| Wind+Battery | 34 months | 76 |
| Solar+Battery | 27 months | 2,377 |
| Battery | 24 months | 2,818 |
Wind projects had the highest wait times at the end of 2023 with an average age of 40 months (3.33 years). Solar projects, on the other hand, made up more than 40% of projects in queue.
Overall, reducing the time that these renewable energy projects spend in queues can accelerate the transition to a low-carbon energy future.
According to the U.S. Department of Energy, enhancing data transparency, streamlining approval processes, promoting economic efficiency, and maintaining a reliable grid are some of the ways this growing backlog can be mitigated.

-

 Wealth6 days ago
Charted: Which City Has the Most Billionaires in 2024?
-

 Mining2 weeks ago
Gold vs. S&P 500: Which Has Grown More Over Five Years?
-

 Uranium2 weeks ago
The World’s Biggest Nuclear Energy Producers
-

 Education2 weeks ago
How Hard Is It to Get Into an Ivy League School?
-

 Debt2 weeks ago
How Debt-to-GDP Ratios Have Changed Since 2000
-

 Sports2 weeks ago
The Highest Earning Athletes in Seven Professional Sports
-

 Science2 weeks ago
Visualizing the Average Lifespans of Mammals
-

 Brands1 week ago
How Tech Logos Have Evolved Over Time