Markets
The Making of the “Big Four” Banking Oligopoly in One Chart
The Banking Oligopoly in One Chart
The “Big Four” retail banks in the United States collectively hold 45% of all customer bank deposits for a total of $4.6 trillion.
The fifth biggest retail bank, U.S. Bancorp, is nothing to sneeze at, either. It’s got 3,151 banking offices and employs 65,000 people. However, it still pales in comparison with the Big Four, holding only a mere $271 billion in deposits.
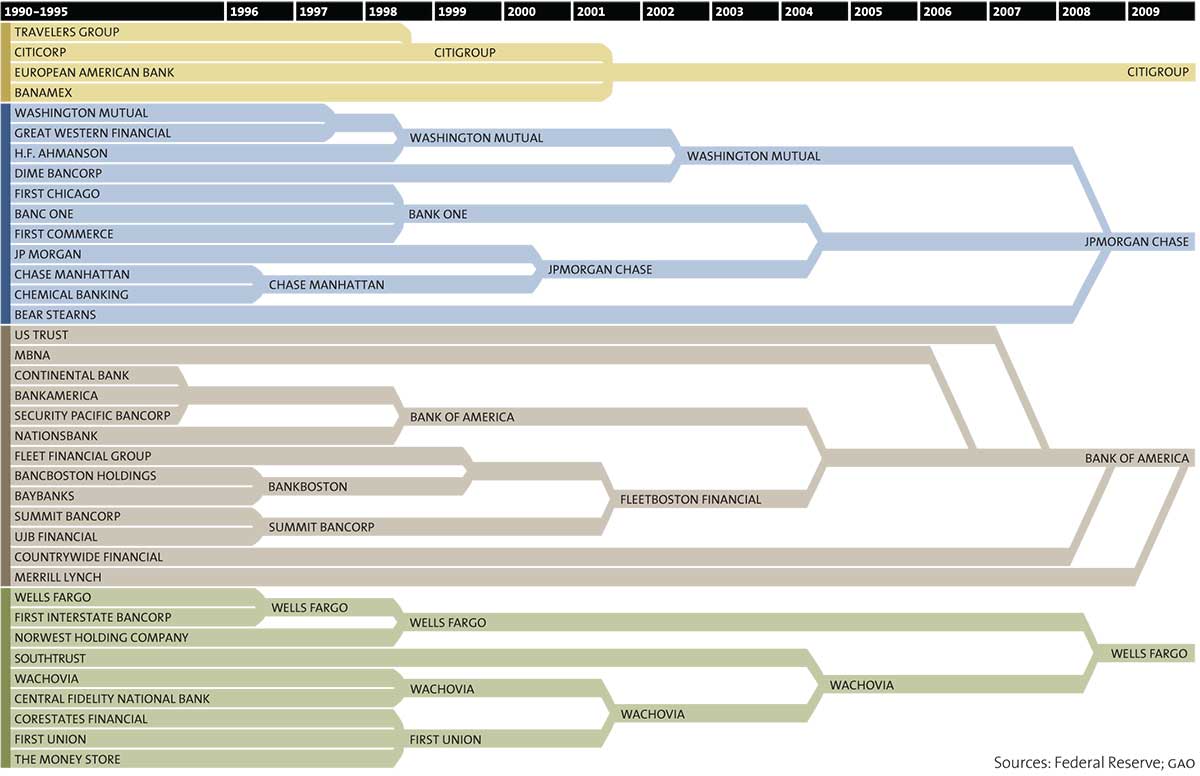
Today’s visualization looks at consolidation in the banking industry over the course of two decades. Between 1990 and 2010, eventually 37 banks would become JP Morgan Chase, Bank of America, Wells Fargo, and Citigroup.
Of particular importance to note is the frequency of consolidation during the 2008 Financial Crisis, when the Big Four were able to gobble up weaker competitors that were overexposed to subprime mortgages. Washington Mutual, Bear Stearns, Countrywide Financial, Merrill Lynch, and Wachovia were all acquired during this time under great duress.
The Big Four is not likely to be challenged anytime soon. In fact, the Federal Reserve has noted in a 2014 paper that the number of new bank charters has basically dropped to zero.
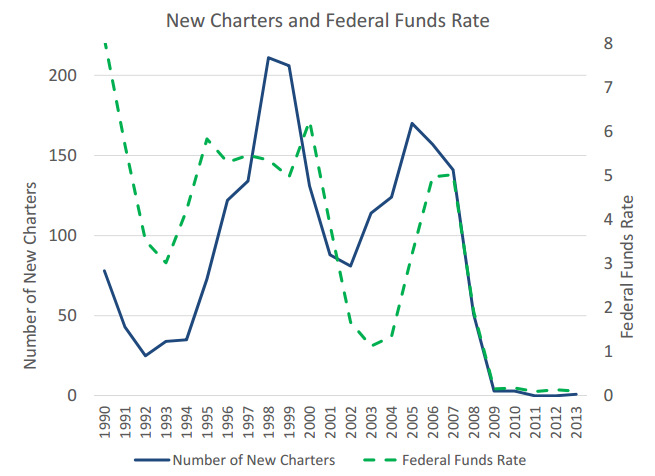
From 2009 to 2013, only seven new banks were formed.
“This dramatic reduction in new bank charters could be a concern for policymakers, if as some suggest, the decline has been caused by increased regulatory burden imposed in response to the financial crisis,” the authors of the Federal Reserve paper write.
Competition from small banks has dried up as a result. A study by George Mason University found that over the last 15 years, the amount of small banks in the country has decreased by -28%.
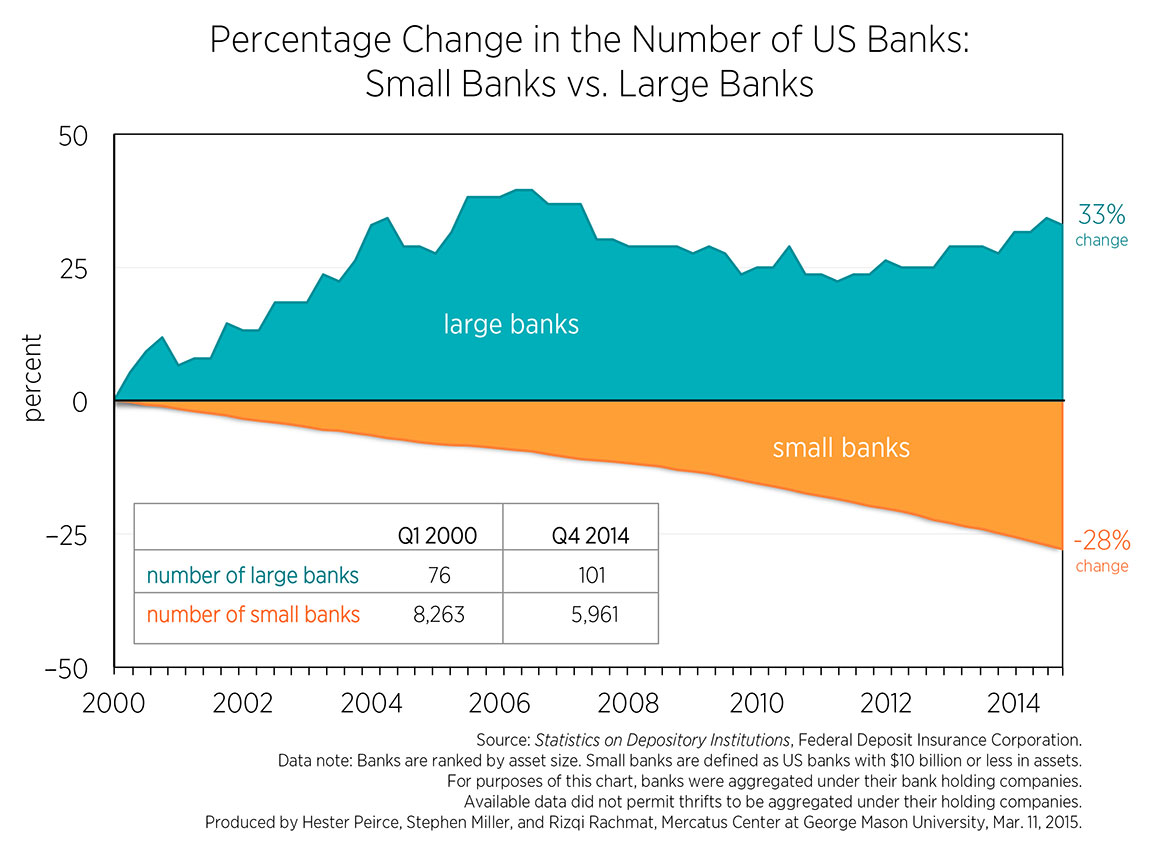
Big banks, on the other hand, are doing relatively quite well. There are now 33% more big banks today than there were in 2000.


Markets
The World’s Fastest Growing Emerging Markets (2024-2029 Forecast)
Here are the emerging markets with the fastest projected growth rates over the next five years based on analysis from the IMF.
The World’s Fastest Growing Emerging Markets (2024-2029)
Large emerging markets are forecast to play a greater role in powering global economic growth in the future, driven by demographic shifts and a growing consumer class.
At the same time, many smaller nations are projected to see their economies grow at double the global average over the next five years due to rich natural resource deposits among other factors. That said, elevated debt levels do present risks to future economic activity.
This graphic shows the emerging markets with the fastest projected growth through to 2029, based on data from the International Monetary Fund’s 2024 World Economic Outlook.
Get the Key Insights of the IMF’s World Economic Outlook
Want a visual breakdown of the insights from the IMF’s 2024 World Economic Outlook report?
This visual is part of a special dispatch of the key takeaways exclusively for VC+ members.
Get the full dispatch of charts by signing up to VC+.
Top 10 Emerging Markets
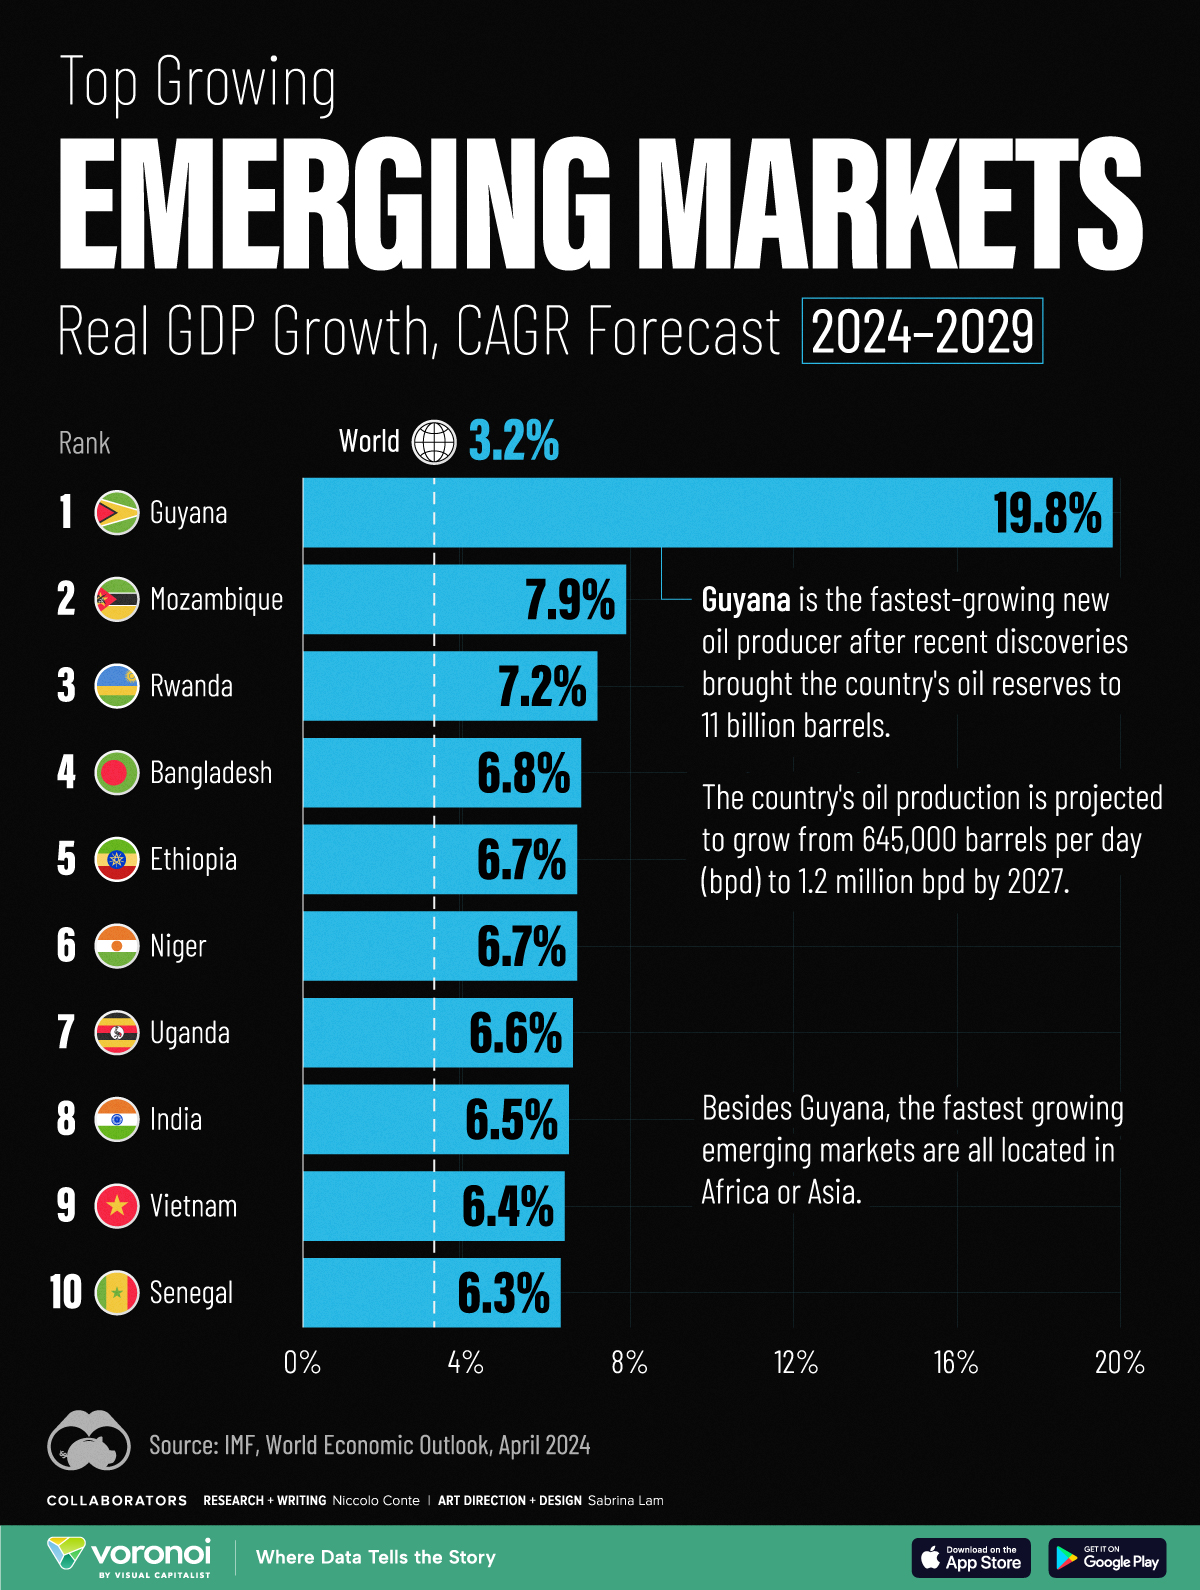
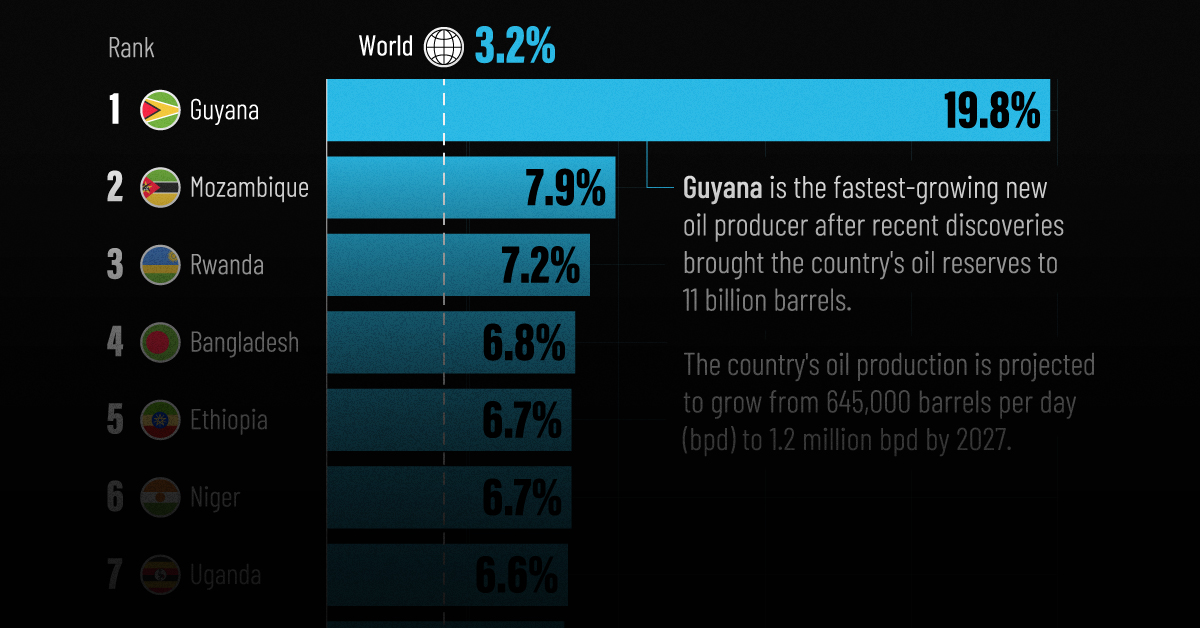
Here are the fastest-growing emerging economies, based on real GDP compound annual growth rate (CAGR) forecasts over the period of 2024-2029:
| Rank | Country | Projected CAGR (2024-2029) |
|---|---|---|
| 1 | 🇬🇾 Guyana | 19.8% |
| 2 | 🇲🇿 Mozambique | 7.9% |
| 3 | 🇷🇼 Rwanda | 7.2% |
| 4 | 🇧🇩 Bangladesh | 6.8% |
| 5 | 🇪🇹 Ethiopia | 6.7% |
| 6 | 🇳🇪 Niger | 6.7% |
| 7 | 🇺🇬 Uganda | 6.6% |
| 8 | 🇮🇳 India | 6.5% |
| 9 | 🇻🇳 Vietnam | 6.4% |
| 10 | 🇸🇳 Senegal | 6.3% |
As South America’s third-smallest nation by land area, Guyana is projected to be the world’s fastest growing economy from now to 2029.
This is thanks to a significant discovery of oil deposits in 2015 by ExxonMobil, which has propelled the country’s economy to grow by fourfold over the last five years alone. By 2028, the nation of just 800,000 people is projected to have the highest crude oil production per capita, outpacing Kuwait for the first time.
Bangladesh, where 85% of exports are driven by the textiles industry, is forecast to see the strongest growth in Asia. In fact, over the last 30 years, the country of 170 million people has not had a single year of negative growth.
In eighth place overall is India, projected to achieve a 6.5% CAGR in real GDP through to 2029. This growth is forecast to be fueled by population trends, public investment, and strong consumer demand.
Get the Full Analysis of the IMF’s Outlook on VC+
This visual is part of an exclusive special dispatch for VC+ members which breaks down the key takeaways from the IMF’s 2024 World Economic Outlook.
For the full set of charts and analysis, sign up for VC+.

-

 Green7 days ago
The Carbon Footprint of Major Travel Methods
-

 Misc2 weeks ago
How Hard Is It to Get Into an Ivy League School?
-

 Debt2 weeks ago
How Debt-to-GDP Ratios Have Changed Since 2000
-

 Sports2 weeks ago
The Highest Earning Athletes in Seven Professional Sports
-

 Science2 weeks ago
Visualizing the Average Lifespans of Mammals
-

 Brands2 weeks ago
How Tech Logos Have Evolved Over Time
-

 Energy2 weeks ago
Ranked: The Top 10 EV Battery Manufacturers in 2023
-

 Demographics2 weeks ago
Countries With the Largest Happiness Gains Since 2010