

This graphic describes new U.S. renewable energy installations by state along with nameplate capacity, planned to come online in 2023.
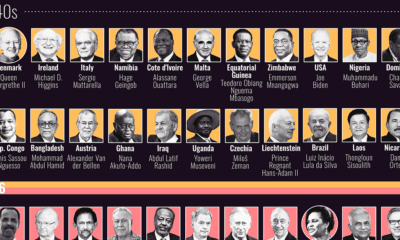

This graphic visualizes the ages of every country’s head of state, and compares them with the median population of their respective states.
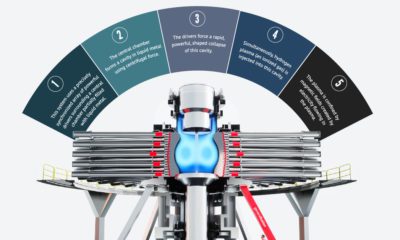

Fusion has the potential to deliver clean, abundant, reliable, and cost-competitive energy.
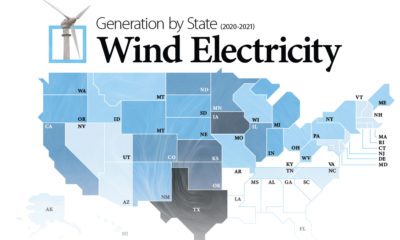

Wind energy is the largest source of renewable electricity in North America. This graphic maps U.S. states by wind electricity generation.
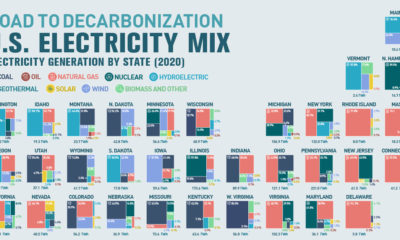

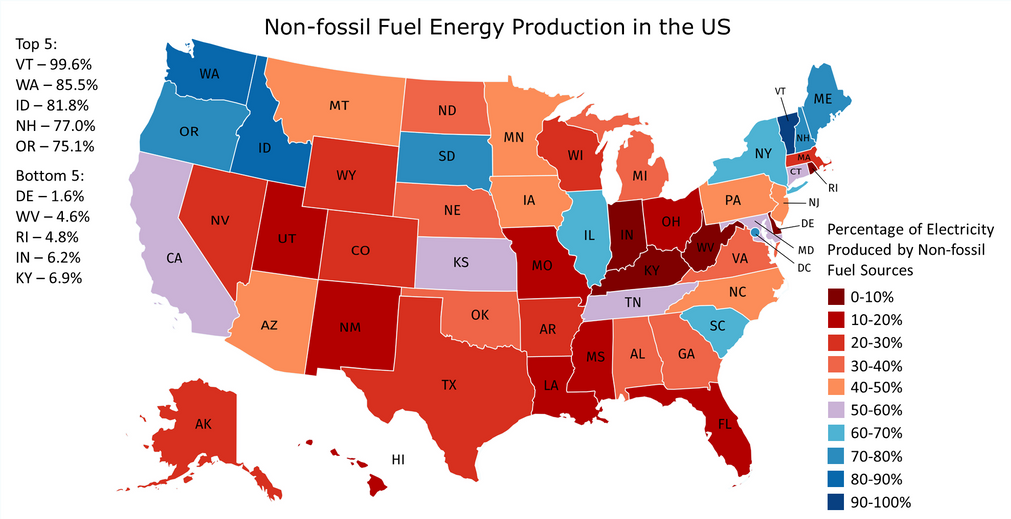
Can America become carbon-free by 2035? This graphic breaks down the United States’ electricity mix, by state.
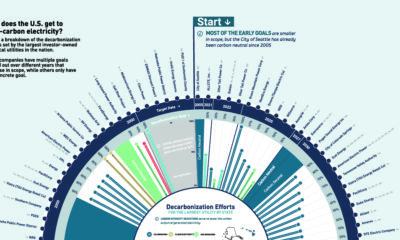

How are utilities reducing carbon emissions? Here are the decarbonization targets of the largest U.S. utilities.
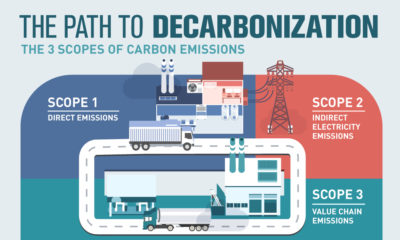

What types of carbon emissions do companies need to be aware of to effectively decarbonize? Here are the 3 scopes of carbon emissions.
In countries where energy is plentiful, we often take the grid for granted. But do you know where your power comes from, and how green it...
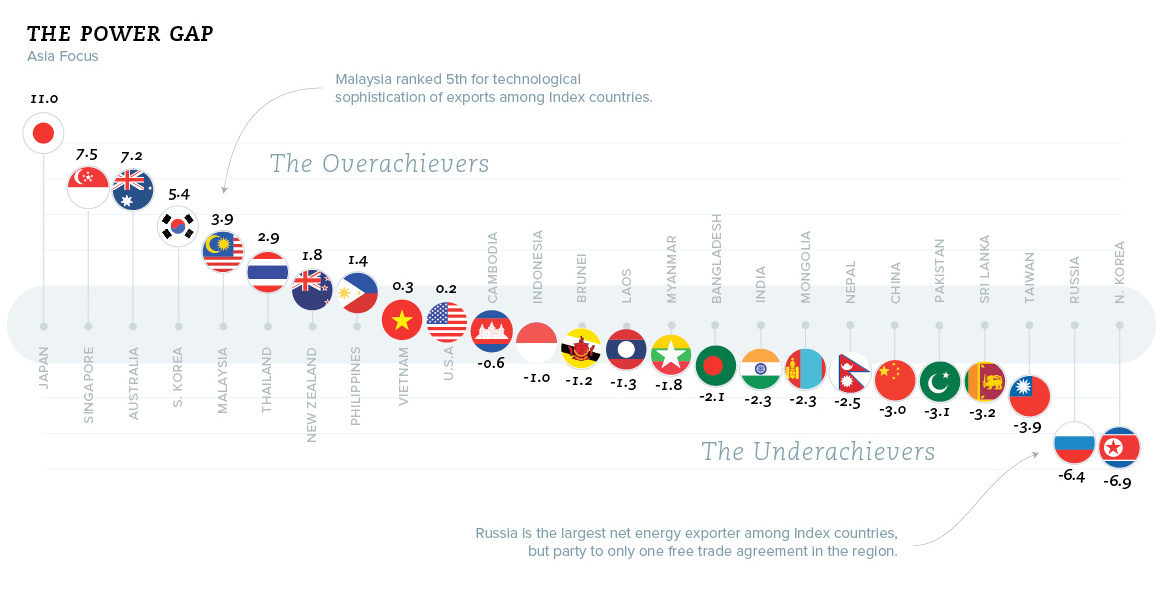
Charting the most influential countries in Asia, plus a look at the countries that punch above their weight class, in terms of power and influence.
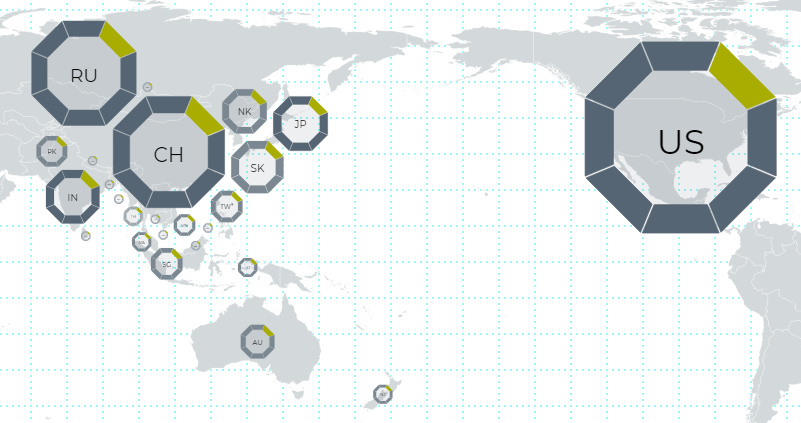
This interactive map uses 114 metrics to measure the geopolitical power and influence of 25 countries, focusing on Asian powers and the United States.


 Creator Program