Money
Quantifying What Success Means, According to 2,000 Americans
The pursuit of success is a part of our cultural DNA.
Almost everyone wants to be successful – and many see it as the basis of the American Dream, which promises that every person can achieve success and prosperity through hard work, determination, and initiative.
However, despite a drive for obtaining success in our culture, the meaning of success isn’t fixed. It can be different things to different people, and there is no possible way of defining success in a way that is representative of every individual person.
Quantifying Success
Although there’s no objective definition of success, there are other ways to arrive at a more impartial meaning.
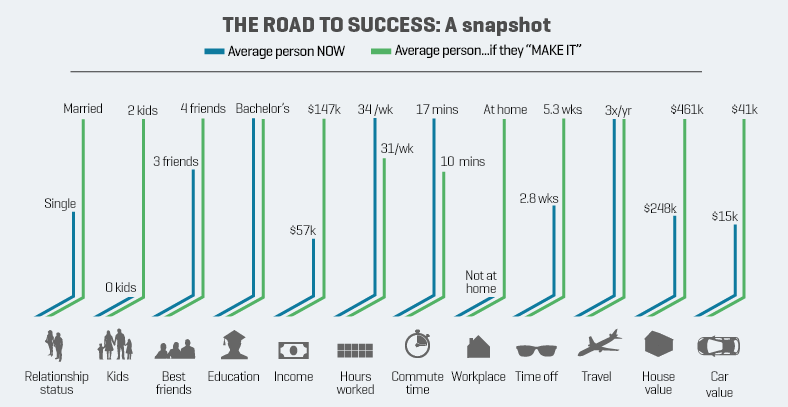
Today’s infographic from Thermosoft uses data from a survey of 2,000 Americans to show what “making it” means to them – and in the process, it gives us a baseline for what success means to the average person.

Survey respondents were asked what “making it” in America meant to them, and then that was compared to what they have.
A variety of individual factors were measured, and each fell within certain categories that could be important to one’s success, including career, family life, wealth, and travel.
Success, on Average
The survey data gives us a view of what success means, on average – and how close people are to “making it”.
Money
Respondents viewed $147,104 of income as “successful”, and this is the area people were furthest away from their ideal.
The average income of respondents was $57,426 – and 67% of respondents said that money was the major missing part of their equation for success.
Work
Respondents viewed 31 hours of work per week, a 10 minute commute, 5.3 weeks of time off, and working more from home as their ideal situation.
However, respondents were a little off on most of these measures, and far off for vacation time. The average person is working 34 hours per week, commuting 17 minutes, taking 2.8 weeks of time off, and working more from the office.
Notably, for 22% of people, a dream job was the missing part of their success equation.
Friends and Family
Respondents viewed marriage and kids, as well as four best friends, as ideal. On average, respondents fell slightly short here, though.
Property
How much would your home and vehicle be worth, if you “made it”? About $461,000 and $41,986 respectively.
Respondents fell short here, with $248,000 and $15,789 values for their home and vehicle.
What’s Missing?
Since success is subjective, the sense of what is “missing” varies considerably.
On average, income was the most important missing factor (67%) and a dream job was also a popular response (22%). Relationships and recognition were both 7%, respectively.
Answers also varied by group – for example, millennials were more likely to say their dream job was the missing factor.
While success may never be defined exactly for all people at all times, this is still an interesting amalgamation of the views that people have towards the subject.
Money
Charted: Which City Has the Most Billionaires in 2024?
Just two countries account for half of the top 20 cities with the most billionaires. And the majority of the other half are found in Asia.

Charted: Which Country Has the Most Billionaires in 2024?
This was originally posted on our Voronoi app. Download the app for free on iOS or Android and discover incredible data-driven charts from a variety of trusted sources.
Some cities seem to attract the rich. Take New York City for example, which has 340,000 high-net-worth residents with investable assets of more than $1 million.
But there’s a vast difference between being a millionaire and a billionaire. So where do the richest of them all live?
Using data from the Hurun Global Rich List 2024, we rank the top 20 cities with the highest number of billionaires in 2024.
A caveat to these rich lists: sources often vary on figures and exact rankings. For example, in last year’s reports, Forbes had New York as the city with the most billionaires, while the Hurun Global Rich List placed Beijing at the top spot.
Ranked: Top 20 Cities with the Most Billionaires in 2024
The Chinese economy’s doldrums over the course of the past year have affected its ultra-wealthy residents in key cities.
Beijing, the city with the most billionaires in 2023, has not only ceded its spot to New York, but has dropped to #4, overtaken by London and Mumbai.
| Rank | City | Billionaires | Rank Change YoY |
|---|---|---|---|
| 1 | 🇺🇸 New York | 119 | +1 |
| 2 | 🇬🇧 London | 97 | +3 |
| 3 | 🇮🇳 Mumbai | 92 | +4 |
| 4 | 🇨🇳 Beijing | 91 | -3 |
| 5 | 🇨🇳 Shanghai | 87 | -2 |
| 6 | 🇨🇳 Shenzhen | 84 | -2 |
| 7 | 🇭🇰 Hong Kong | 65 | -1 |
| 8 | 🇷🇺 Moscow | 59 | No Change |
| 9 | 🇮🇳 New Delhi | 57 | +6 |
| 10 | 🇺🇸 San Francisco | 52 | No Change |
| 11 | 🇹🇭 Bangkok | 49 | +2 |
| 12 | 🇹🇼 Taipei | 45 | +2 |
| 13 | 🇫🇷 Paris | 44 | -2 |
| 14 | 🇨🇳 Hangzhou | 43 | -5 |
| 15 | 🇸🇬 Singapore | 42 | New to Top 20 |
| 16 | 🇨🇳 Guangzhou | 39 | -4 |
| 17T | 🇮🇩 Jakarta | 37 | +1 |
| 17T | 🇧🇷 Sao Paulo | 37 | No Change |
| 19T | 🇺🇸 Los Angeles | 31 | No Change |
| 19T | 🇰🇷 Seoul | 31 | -3 |
In fact all Chinese cities on the top 20 list have lost billionaires between 2023–24. Consequently, they’ve all lost ranking spots as well, with Hangzhou seeing the biggest slide (-5) in the top 20.
Where China lost, all other Asian cities—except Seoul—in the top 20 have gained ranks. Indian cities lead the way, with New Delhi (+6) and Mumbai (+3) having climbed the most.
At a country level, China and the U.S combine to make up half of the cities in the top 20. They are also home to about half of the world’s 3,200 billionaire population.
In other news of note: Hurun officially counts Taylor Swift as a billionaire, estimating her net worth at $1.2 billion.
-

 Science1 week ago
Visualizing the Average Lifespans of Mammals
-

 Markets2 weeks ago
The Top 10 States by Real GDP Growth in 2023
-

 Demographics2 weeks ago
The Smallest Gender Wage Gaps in OECD Countries
-

 United States2 weeks ago
Where U.S. Inflation Hit the Hardest in March 2024
-

 Green2 weeks ago
Top Countries By Forest Growth Since 2001
-

 United States2 weeks ago
Ranked: The Largest U.S. Corporations by Number of Employees
-

 Maps2 weeks ago
The Largest Earthquakes in the New York Area (1970-2024)
-

 Green2 weeks ago
Ranked: The Countries With the Most Air Pollution in 2023


