Technology
Visualizing How Much Countries Spend on R&D
Visualizing How Much Countries Spend on R&D
Innovation can be a major competitive advantage for any developed economy.
However, achieving a sustainable rate of innovation isn’t necessarily a straightforward exercise. The reality is that innovation is a complex and difficult outcome to measure, and there are many different variables that factor into it at a national level.
Research and development (R&D) expenditure is certainly one of these factors – and while it doesn’t always directly correlate with innovation outcomes, it does represent time, capital, and effort being put into researching and designing the products of the future.
Measuring R&D Spend
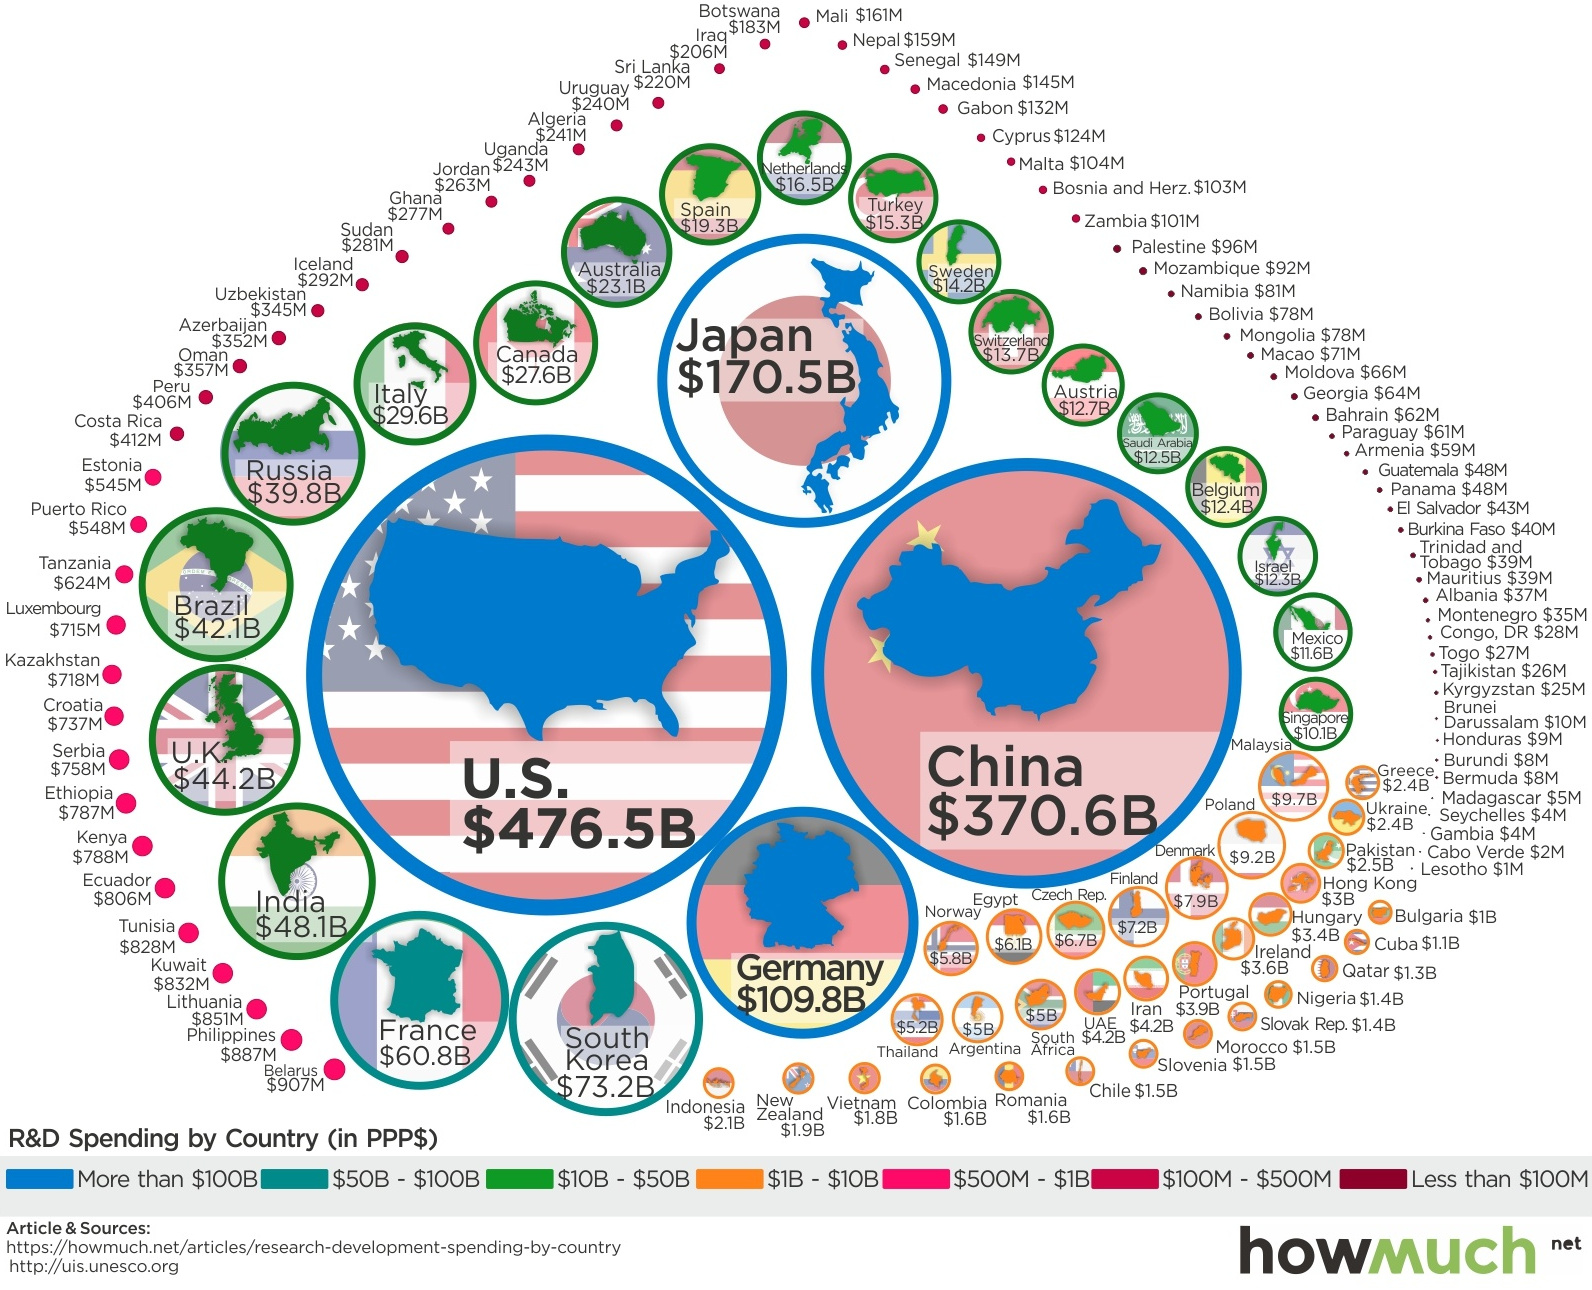
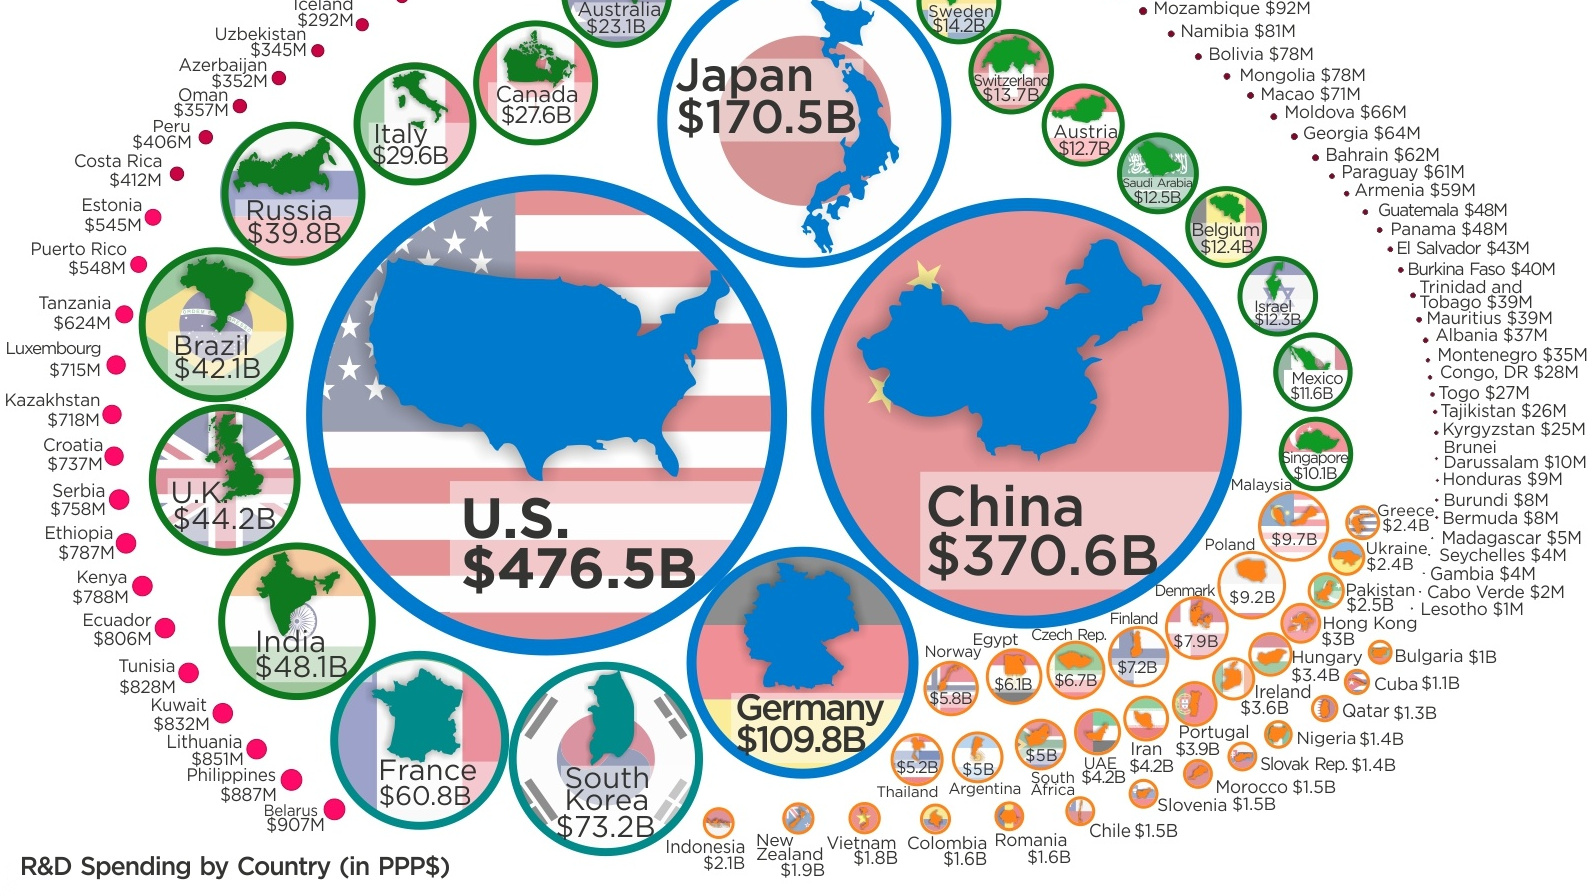
Today’s infographic comes to us from HowMuch.net, and it compares R&D numbers for nearly every country in the world. It uses data from the UNESCO Institute for Statistics adjusted for purchasing-power parity (PPP).
As you can see, R&D expenditures are heavily concentrated at the top of the food chain:
| Rank | Country | R&D Spending (PPP) | Global share (%) |
|---|---|---|---|
| #1 | United States | $476.5 billion | 26.4% |
| #2 | China | $370.6 billion | 20.6% |
| #3 | Japan | $170.5 billion | 9.5% |
| #4 | Germany | $109.8 billion | 6.1% |
| #5 | South Korea | $73.2 billion | 4.1% |
| #6 | France | $60.8 billion | 3.4% |
| #7 | India | $48.1 billion | 2.7% |
| #8 | United Kingdom | $44.2 billion | 2.5% |
| #9 | Brazil | $42.1 billion | 2.3% |
| #10 | Russia | $39.8 billion | 2.2% |
| #11 | Italy | $29.6 billion | 1.6% |
| #12 | Canada | $27.6 billion | 1.5% |
| #13 | Australia | $23.1 billion | 1.3% |
| #14 | Spain | $19.3 billion | 1.1% |
| #15 | Netherlands | $16.5 billion | 0.9% |
| All other countries | $249.8 billion | 13.9% |
Put together the numbers for the U.S. ($476.5 billion) and China ($370.6 billion), and it amounts to 47.0% of total global R&D expenditures. Add in Japan and Germany, and the total goes to 62.5%.
At same time, the countries left off the above list don’t even combine for 15% of the world’s total R&D expenditures.
As a Percentage of GDP
Measuring R&D in absolute terms shows where most of the world’s research happens, but it fails to capture the countries that are spending more in relative terms.
Which countries allocate the highest percentage of their economy to research and development?
| Rank | Country | R&D (as a % of GDP) |
|---|---|---|
| #1 | South Korea | 4.3% |
| #2 | Israel | 4.2% |
| #3 | Japan | 3.4% |
| #4 | Switzerland | 3.2% |
| #5 | Finland | 3.2% |
| #6 | Austria | 3.1% |
| #7 | Sweden | 3.1% |
| #8 | Denmark | 2.9% |
| #9 | Germany | 2.9% |
| #10 | United States | 2.7% |
As you can see, countries like South Korea and Japan allocate the highest portion of their economies to R&D, which is part of the reason they rank so highly on the list in absolute terms as well.
Meanwhile, there are some smaller economies – namely Israel (4.2%) – that spend a far higher portion than normal on research.


Technology
All of the Grants Given by the U.S. CHIPS Act
Intel, TSMC, and more have received billions in subsidies from the U.S. CHIPS Act in 2024.


All of the Grants Given by the U.S. CHIPS Act
This was originally posted on our Voronoi app. Download the app for free on iOS or Android and discover incredible data-driven charts from a variety of trusted sources.
This visualization shows which companies are receiving grants from the U.S. CHIPS Act, as of April 25, 2024. The CHIPS Act is a federal statute signed into law by President Joe Biden that authorizes $280 billion in new funding to boost domestic research and manufacturing of semiconductors.
The grant amounts visualized in this graphic are intended to accelerate the production of semiconductor fabrication plants (fabs) across the United States.
Data and Company Highlights
The figures we used to create this graphic were collected from a variety of public news sources. The Semiconductor Industry Association (SIA) also maintains a tracker for CHIPS Act recipients, though at the time of writing it does not have the latest details for Micron.
| Company | Federal Grant Amount | Anticipated Investment From Company |
|---|---|---|
| 🇺🇸 Intel | $8,500,000,000 | $100,000,000,000 |
| 🇹🇼 TSMC | $6,600,000,000 | $65,000,000,000 |
| 🇰🇷 Samsung | $6,400,000,000 | $45,000,000,000 |
| 🇺🇸 Micron | $6,100,000,000 | $50,000,000,000 |
| 🇺🇸 GlobalFoundries | $1,500,000,000 | $12,000,000,000 |
| 🇺🇸 Microchip | $162,000,000 | N/A |
| 🇬🇧 BAE Systems | $35,000,000 | N/A |
BAE Systems was not included in the graphic due to size limitations
Intel’s Massive Plans
Intel is receiving the largest share of the pie, with $8.5 billion in grants (plus an additional $11 billion in government loans). This grant accounts for 22% of the CHIPS Act’s total subsidies for chip production.
From Intel’s side, the company is expected to invest $100 billion to construct new fabs in Arizona and Ohio, while modernizing and/or expanding existing fabs in Oregon and New Mexico. Intel could also claim another $25 billion in credits through the U.S. Treasury Department’s Investment Tax Credit.
TSMC Expands its U.S. Presence
TSMC, the world’s largest semiconductor foundry company, is receiving a hefty $6.6 billion to construct a new chip plant with three fabs in Arizona. The Taiwanese chipmaker is expected to invest $65 billion into the project.
The plant’s first fab will be up and running in the first half of 2025, leveraging 4 nm (nanometer) technology. According to TrendForce, the other fabs will produce chips on more advanced 3 nm and 2 nm processes.
The Latest Grant Goes to Micron
Micron, the only U.S.-based manufacturer of memory chips, is set to receive $6.1 billion in grants to support its plans of investing $50 billion through 2030. This investment will be used to construct new fabs in Idaho and New York.

-

 Energy1 week ago
The World’s Biggest Nuclear Energy Producers
-

 Money2 weeks ago
Which States Have the Highest Minimum Wage in America?
-

 Technology2 weeks ago
Ranked: Semiconductor Companies by Industry Revenue Share
-

 Markets2 weeks ago
Ranked: The World’s Top Flight Routes, by Revenue
-

 Demographics2 weeks ago
Population Projections: The World’s 6 Largest Countries in 2075
-

 Markets2 weeks ago
The Top 10 States by Real GDP Growth in 2023
-

 Demographics2 weeks ago
The Smallest Gender Wage Gaps in OECD Countries
-

 Economy2 weeks ago
Where U.S. Inflation Hit the Hardest in March 2024