Markets
How Many Hours Americans Need to Work to Pay Their Mortgage
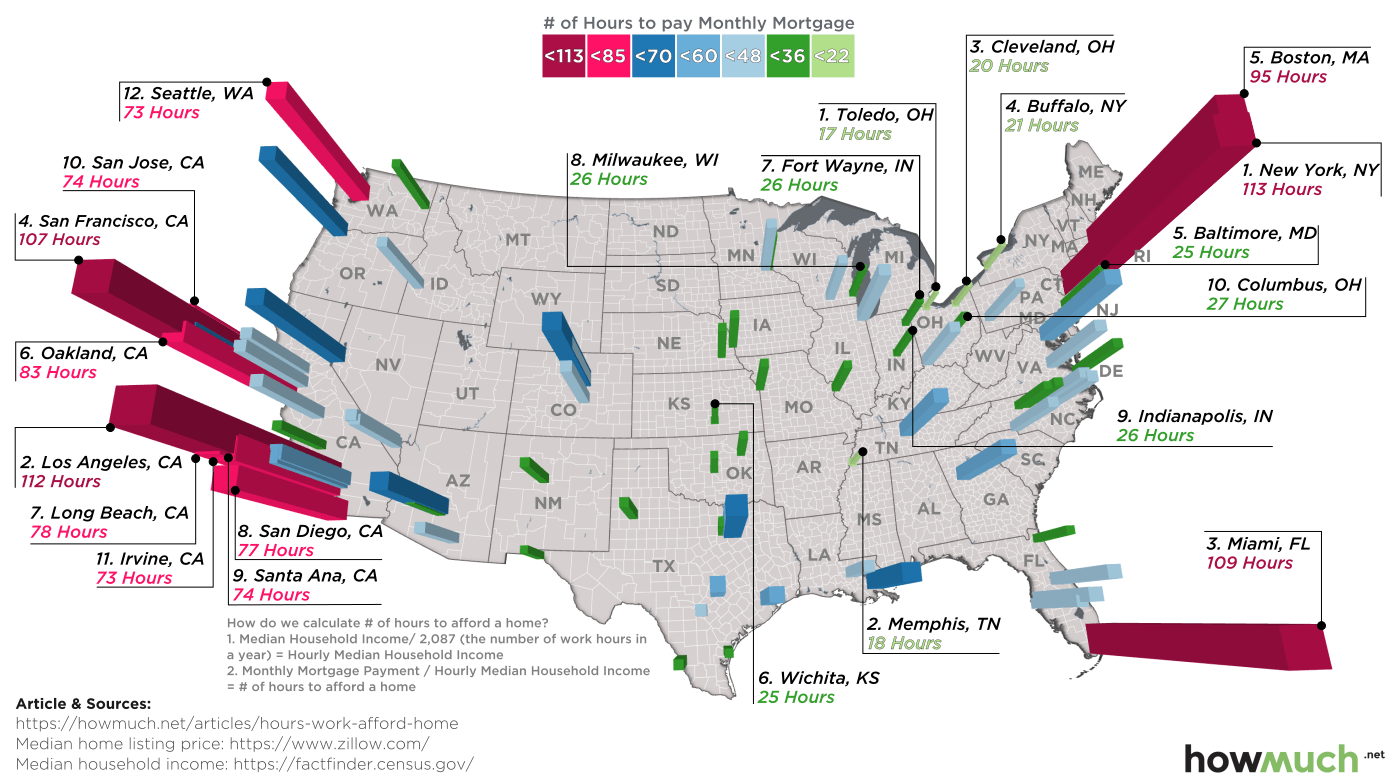
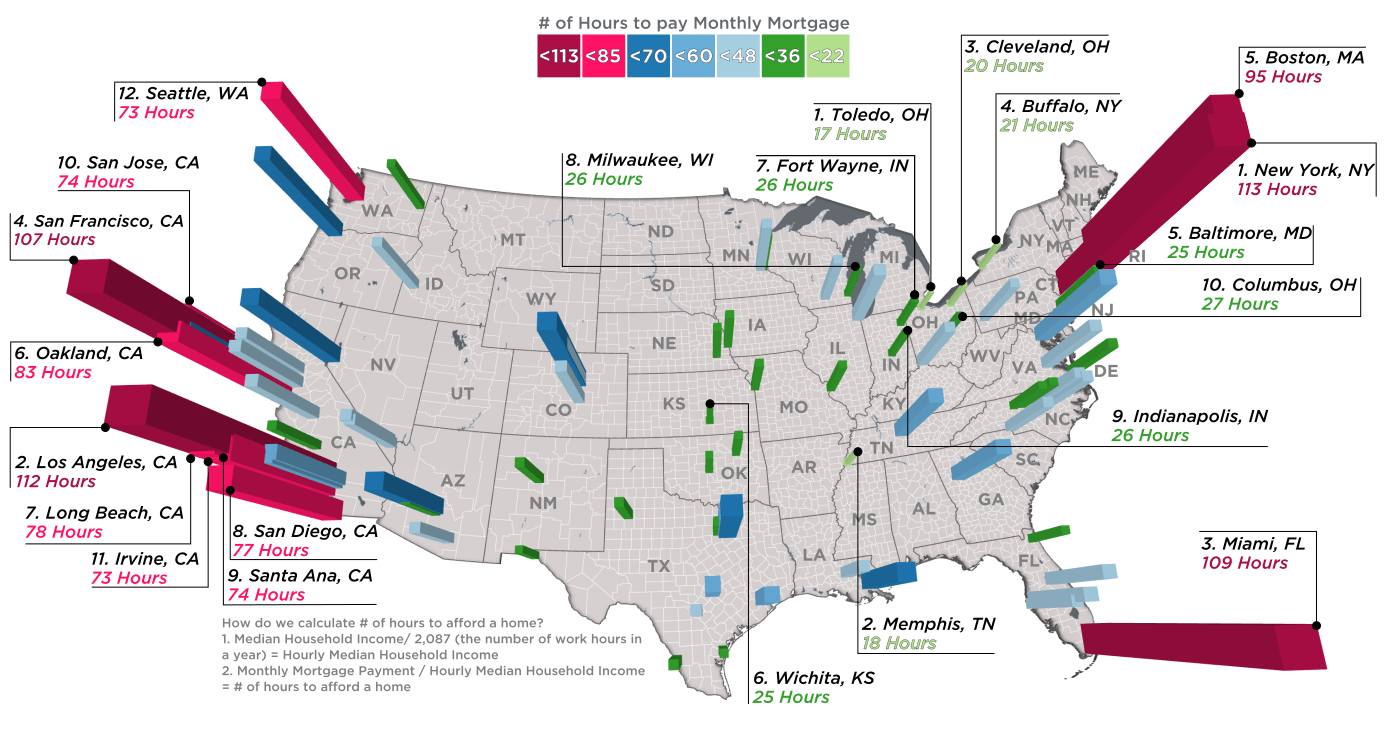
How Many Hours Americans Need to Work to Afford a Home
When it comes to the cost of living in cities, a general rule of thumb is that housing prices are much higher in the country’s economic and population hubs, especially in the cities along the coasts.
Particularly in recent years, prices have been pushed sky-high in places like New York City or San Francisco through a combination of limited supply of new homes, increasing demand, shifting demographics, and government regulations.
Putting it Into Perspective
Today’s visualization from HowMuch.net applies a common denominator to compare 97 of the biggest cities in the United States. Using a measure of median household income against the average mortgage payment in each city, we get a gauge of how many hours must be worked each month just to pay down the house.
The visualization uses data from the U.S. Census for household income and Zillow for median home listing price, while calculating mortgage payments based on a standard 30-year term.
The Results
Using the above method to compare the amount of hours it takes to pay down a monthly mortgage, we see some interesting contrasts in the country.
Here are the five most expensive cities in the United States for housing:
| Rank | City | Median Income | Median Listing | Hours of Work to Pay Mortgage |
|---|---|---|---|---|
| #1 | New York City | $53,373 | $798,000 | 113.5 |
| #2 | Los Angeles | $50,205 | $748,000 | 112.4 |
| #3 | Miami | $31,051 | $449,000 | 109.4 |
| #4 | San Francisco | $82,294 | $1,150,000 | 106.7 |
| #5 | Boston | $55,777 | $699,000 | 94.7 |
With about 170 hours in a normal work month, the average people in these cities are spending 50% or more of their income just to pay down their mortgages. It’s worst in New York City and Los Angeles, where at least 65% of income is going towards housing.
These cities stand in stark contrast to the five cheapest cities based on hours of work needed:
| Rank | City | Median Income | Median Listing | Hours of Work to Pay Mortgage |
|---|---|---|---|---|
| #93 | Baltimore | $42,241 | $139,000 | 24.9 |
| #94 | Buffalo | $31,918 | $90,000 | 21.4 |
| #95 | Cleveland | $26,150 | $70,000 | 20.3 |
| #96 | Memphis | $36,445 | $88,500 | 18.4 |
| #97 | Toledo | $33,687 | $74,900 | 16.9 |
In a city like Memphis, TN it takes only 18.4 hours of work a month to pay down the average mortgage. That’s equal to only about 10% of monthly household income.
Coastal Disparity
Interestingly, even though coastal hubs have high prices relative to the cities in the middle of the country, they differ quite widely against each other. This discrepancy does not necessarily show in terms of ranking, but more in terms of the actual hours of work needed.
| Rank | City | Median Income | Median Listing | Hours of Work to Pay Mortgage |
|---|---|---|---|---|
| #1 | New York City | $53,373 | $798,000 | 113.5 |
| #2 | Los Angeles | $50,205 | $748,000 | 112.4 |
| #4 | San Francisco | $82,294 | $1,150,000 | 106.7 |
| #5 | Boston | $55,777 | $699,000 | 94.7 |
| #10 | San Jose | $84,647 | $825,000 | 73.5 |
| #12 | Seattle | $70,594 | $679,000 | 72.8 |
| #24 | Washington, D.C. | $70,848 | $550,000 | 58.9 |
Washington, D.C., for example, requires less than half the hours of work to pay down a mortgage than Los Angeles or New York City. Meanwhile, a popular west coast hub like Seattle only needs 72.8 hours in comparison to New York’s 113.5 hours.


Markets
The European Stock Market: Attractive Valuations Offer Opportunities
On average, the European stock market has valuations that are nearly 50% lower than U.S. valuations. But how can you access the market?


European Stock Market: Attractive Valuations Offer Opportunities
Europe is known for some established brands, from L’Oréal to Louis Vuitton. However, the European stock market offers additional opportunities that may be lesser known.
The above infographic, sponsored by STOXX, outlines why investors may want to consider European stocks.
Attractive Valuations
Compared to most North American and Asian markets, European stocks offer lower or comparable valuations.
| Index | Price-to-Earnings Ratio | Price-to-Book Ratio |
|---|---|---|
| EURO STOXX 50 | 14.9 | 2.2 |
| STOXX Europe 600 | 14.4 | 2 |
| U.S. | 25.9 | 4.7 |
| Canada | 16.1 | 1.8 |
| Japan | 15.4 | 1.6 |
| Asia Pacific ex. China | 17.1 | 1.8 |
Data as of February 29, 2024. See graphic for full index names. Ratios based on trailing 12 month financials. The price to earnings ratio excludes companies with negative earnings.
On average, European valuations are nearly 50% lower than U.S. valuations, potentially offering an affordable entry point for investors.
Research also shows that lower price ratios have historically led to higher long-term returns.
Market Movements Not Closely Connected
Over the last decade, the European stock market had low-to-moderate correlation with North American and Asian equities.
The below chart shows correlations from February 2014 to February 2024. A value closer to zero indicates low correlation, while a value of one would indicate that two regions are moving in perfect unison.
| EURO STOXX 50 | STOXX EUROPE 600 | U.S. | Canada | Japan | Asia Pacific ex. China |
|
|---|---|---|---|---|---|---|
| EURO STOXX 50 | 1.00 | 0.97 | 0.55 | 0.67 | 0.24 | 0.43 |
| STOXX EUROPE 600 | 1.00 | 0.56 | 0.71 | 0.28 | 0.48 | |
| U.S. | 1.00 | 0.73 | 0.12 | 0.25 | ||
| Canada | 1.00 | 0.22 | 0.40 | |||
| Japan | 1.00 | 0.88 | ||||
| Asia Pacific ex. China | 1.00 |
Data is based on daily USD returns.
European equities had relatively independent market movements from North American and Asian markets. One contributing factor could be the differing sector weights in each market. For instance, technology makes up a quarter of the U.S. market, but health care and industrials dominate the broader European market.
Ultimately, European equities can enhance portfolio diversification and have the potential to mitigate risk for investors.
Tracking the Market
For investors interested in European equities, STOXX offers a variety of flagship indices:
| Index | Description | Market Cap |
|---|---|---|
| STOXX Europe 600 | Pan-regional, broad market | €10.5T |
| STOXX Developed Europe | Pan-regional, broad-market | €9.9T |
| STOXX Europe 600 ESG-X | Pan-regional, broad market, sustainability focus | €9.7T |
| STOXX Europe 50 | Pan-regional, blue-chip | €5.1T |
| EURO STOXX 50 | Eurozone, blue-chip | €3.5T |
Data is as of February 29, 2024. Market cap is free float, which represents the shares that are readily available for public trading on stock exchanges.
The EURO STOXX 50 tracks the Eurozone’s biggest and most traded companies. It also underlies one of the world’s largest ranges of ETFs and mutual funds. As of November 2023, there were €27.3 billion in ETFs and €23.5B in mutual fund assets under management tracking the index.
“For the past 25 years, the EURO STOXX 50 has served as an accurate, reliable and tradable representation of the Eurozone equity market.”
— Axel Lomholt, General Manager at STOXX
Partnering with STOXX to Track the European Stock Market
Are you interested in European equities? STOXX can be a valuable partner:
- Comprehensive, liquid and investable ecosystem
- European heritage, global reach
- Highly sophisticated customization capabilities
- Open architecture approach to using data
- Close partnerships with clients
- Part of ISS STOXX and Deutsche Börse Group
With a full suite of indices, STOXX can help you benchmark against the European stock market.
Learn how STOXX’s European indices offer liquid and effective market access.

-

 Economy4 days ago
Economic Growth Forecasts for G7 and BRICS Countries in 2024
The IMF has released its economic growth forecasts for 2024. How do the G7 and BRICS countries compare?
-

 Markets2 weeks ago
U.S. Debt Interest Payments Reach $1 Trillion
U.S. debt interest payments have surged past the $1 trillion dollar mark, amid high interest rates and an ever-expanding debt burden.
-

 United States2 weeks ago
Ranked: The Largest U.S. Corporations by Number of Employees
We visualized the top U.S. companies by employees, revealing the massive scale of retailers like Walmart, Target, and Home Depot.
-

 Markets3 weeks ago
The Top 10 States by Real GDP Growth in 2023
This graphic shows the states with the highest real GDP growth rate in 2023, largely propelled by the oil and gas boom.
-

 Markets3 weeks ago
Ranked: The World’s Top Flight Routes, by Revenue
In this graphic, we show the highest earning flight routes globally as air travel continued to rebound in 2023.
-

 Markets3 weeks ago
Ranked: The Most Valuable Housing Markets in America
The U.S. residential real estate market is worth a staggering $47.5 trillion. Here are the most valuable housing markets in the country.

-

 Lithium6 days ago
Ranked: The Top 10 EV Battery Manufacturers in 2023
-

 Green2 weeks ago
Top Countries By Forest Growth Since 2001
-
United States2 weeks ago
Ranked: The Largest U.S. Corporations by Number of Employees
-

 Maps2 weeks ago
The Largest Earthquakes in the New York Area (1970-2024)
-

 Green2 weeks ago
Ranked: The Countries With the Most Air Pollution in 2023
-

 Green2 weeks ago
Ranking the Top 15 Countries by Carbon Tax Revenue
-
Markets2 weeks ago
U.S. Debt Interest Payments Reach $1 Trillion
-

 Mining2 weeks ago
Gold vs. S&P 500: Which Has Grown More Over Five Years?