Technology
Chart: The Global Leaders in R&D Spending, by Country and Company
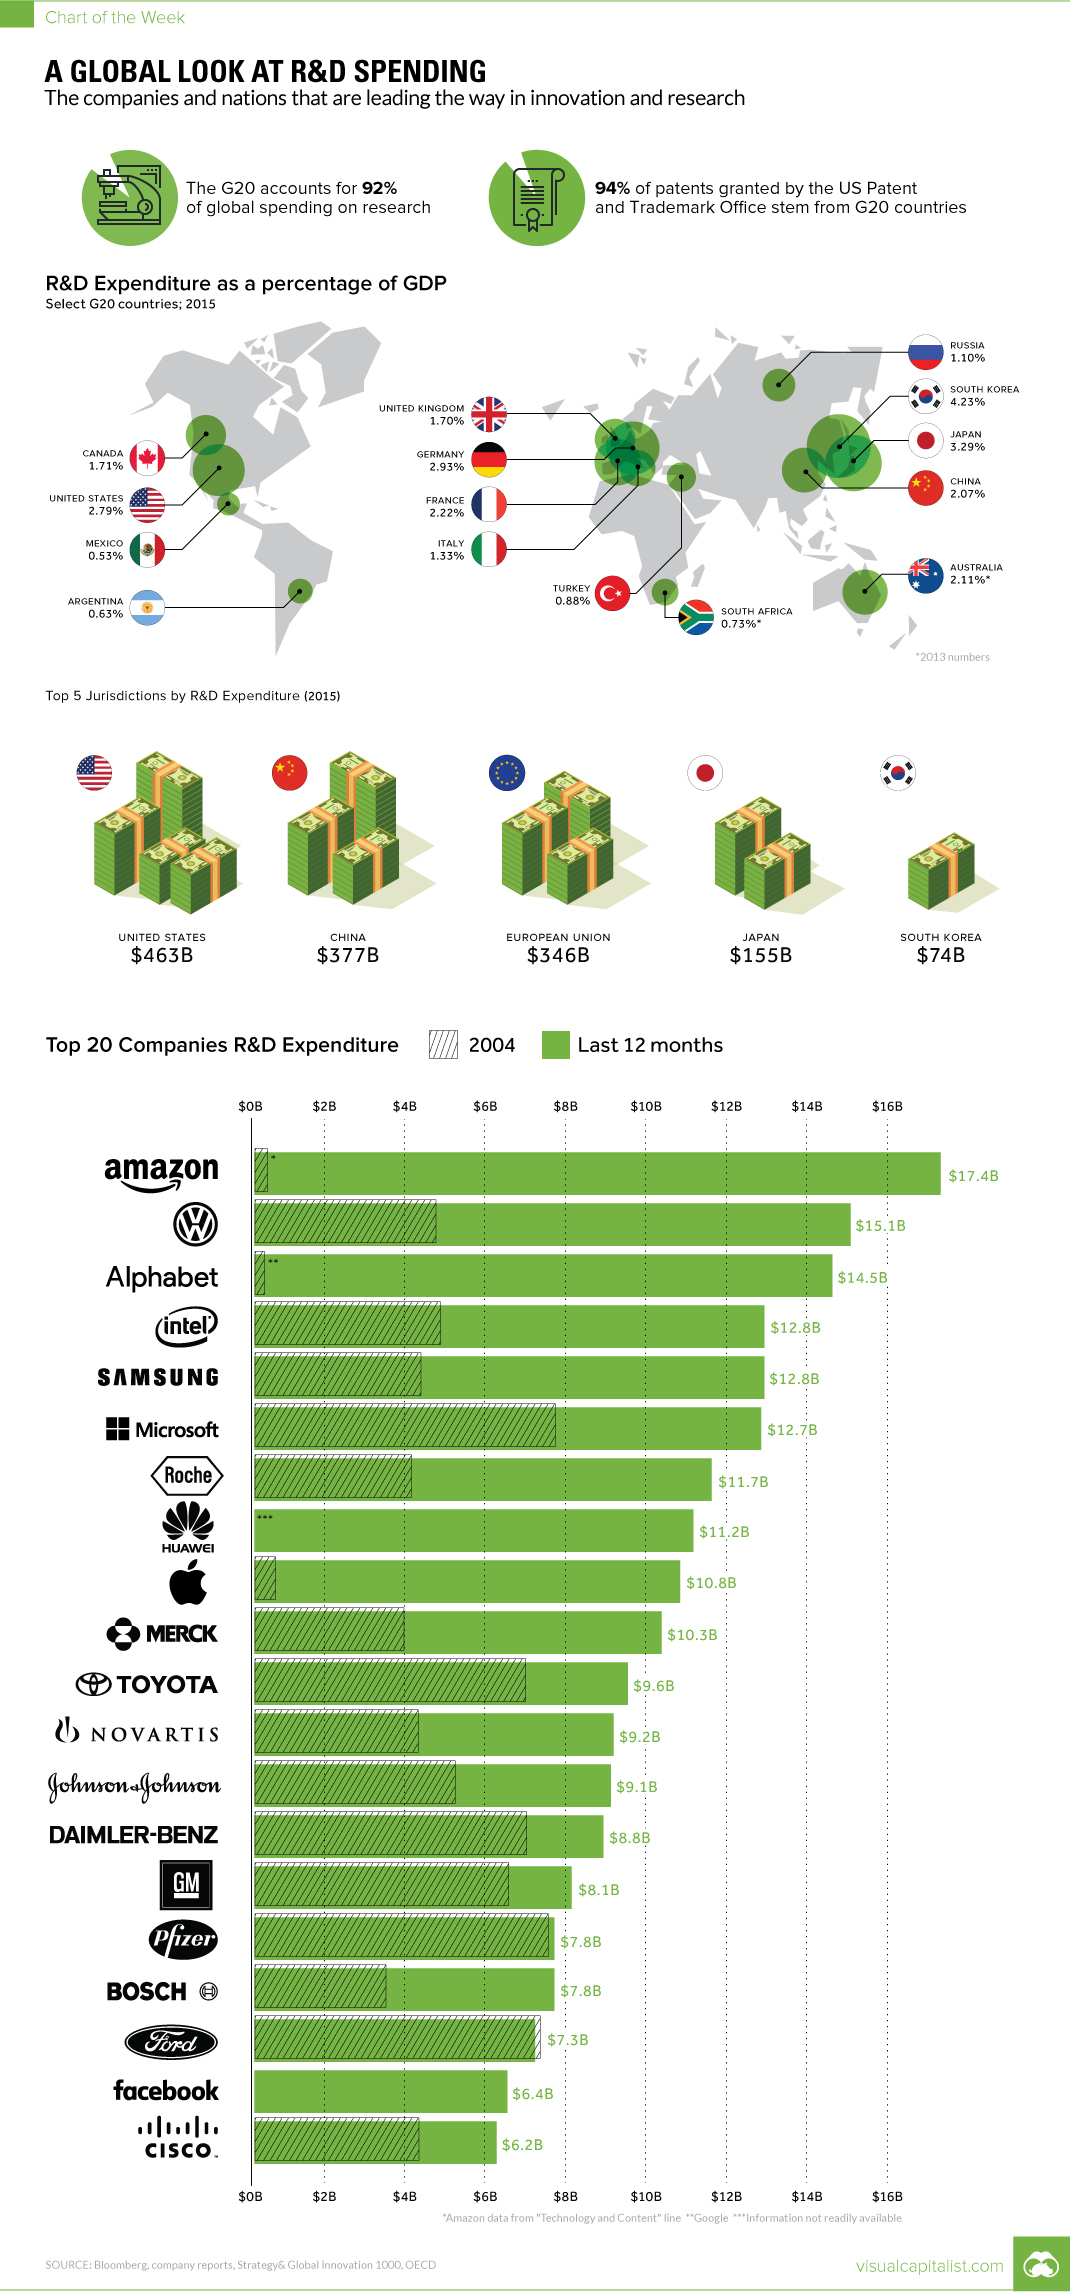
Chart: The Global Leaders in R&D Spending
The countries and firms that put the most into R&D
The Chart of the Week is a weekly Visual Capitalist feature on Fridays.
Given a choice of being the disruptor or the disrupted, many would prefer to choose the former.
But it’s not as easy as just flipping a switch and subsequently reaping the benefits of a forward-looking vision, new product categories, and forthcoming patents. Instead, an organization has to proactively acquire this innovation and intellectual capital from somewhere.
For many established companies, there is no other choice but to buy innovative startups through M&A to get their innovation fix, though this typically comes at a marked up price. On the flipside, especially for companies in tech, auto, and pharmaceutical spaces, innovation likely has to be in the DNA of the company culture, managerial decisions, and any new talent hired.
Global Leaders in R&D Spending
For those companies that aim to innovate internally, money needs to go into the research and development (R&D) line of their income statement.
Today’s chart looks at the countries that put the most into R&D (in % of GDP terms, and absolute $ terms), as well as the companies that have spent the most on R&D in the last 12 months trailing.
It’s also worth noting that money put into R&D is like any other investment – the money can be used wisely or simply squandered into initiatives that don’t pay off. Despite this, R&D spending is a loose approximation for global innovation.
R&D by Country
Global R&D spending is heavily concentrated in the G20 countries. In total they account for 92% of all R&D spending, and 94% of all patents granted at the U.S. Patent and Trademark office.
Here is a breakdown of R&D spending by GDP of select G20 countries:
| Country | R&D Spending (% GDP) |
|---|---|
| South Korea | 4.23% |
| Japan | 3.29% |
| Germany | 2.93% |
| United States | 2.79% |
| France | 2.22% |
| Australia | 2.11% |
| China | 2.07% |
| Canada | 1.71% |
| United Kingdom | 1.70% |
| Italy | 1.33% |
| Russia | 1.10% |
| Turkey | 0.88% |
| South Africa | 0.73% |
| Argentina | 0.63% |
| Mexico | 0.53% |
By total dollar spend, however, massive economies like the United States, China, and the EU take their rightful place.
| Rank | Economy | R&D Spending ($) in 2015 |
|---|---|---|
| #1 | United States | $463 billion |
| #2 | China | $377 billion |
| #3 | European Union | $346 billion |
| #4 | Japan | $155 billion |
| #5 | South Korea | $74 billion |
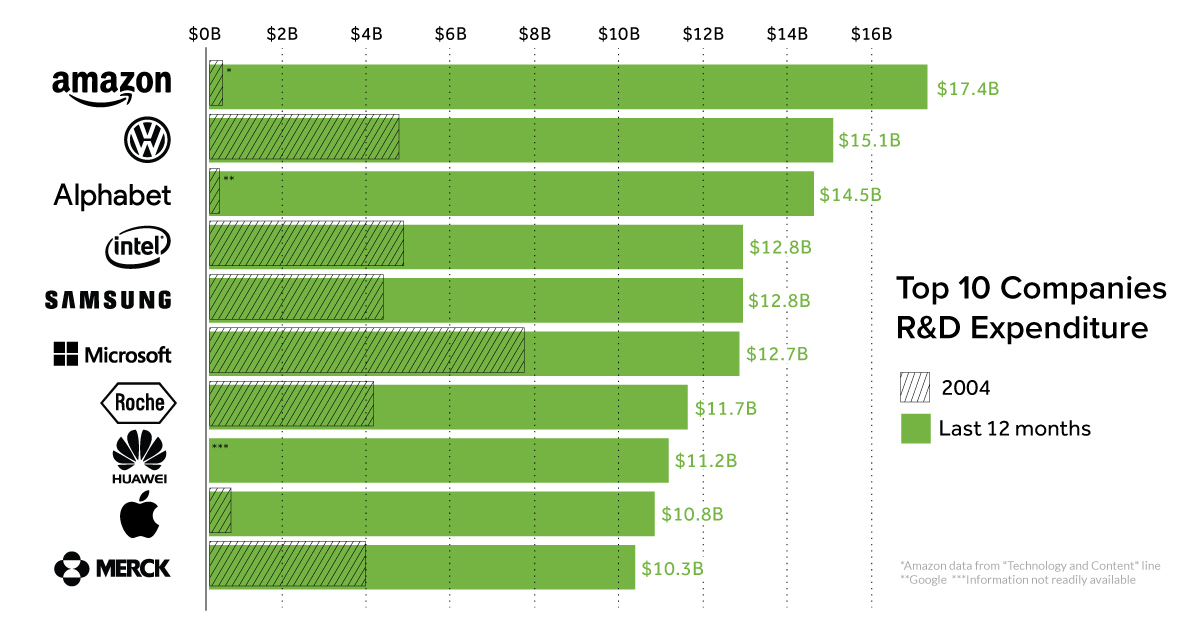
R&D by Company
On a company basis, the top five R&D spenders today are mostly technology companies.
| Rank | Company | R&D Spending (Last 12 months) |
|---|---|---|
| #1 | Amazon | $17.4 billion |
| #2 | Volkswagen | $15.1 billion |
| #3 | Alphabet | $14.5 billion |
| #4 | Intel | $12.8 billion |
| #5 | Samsung | $12.8 billion |
Interestingly, that wasn’t always the case – even as short as 10 years ago, the largest R&D spenders tended to be pharmaceutical companies like Pfizer, or automobile manufacturers like GM and Volkswagen.
A final note: Amazon doesn’t list R&D on its income statement directly, and instead classifies everything under a “Technology and Content” line which includes R&D. While it is likely Amazon is an R&D leader, there isn’t an exact number for it as of now.


Technology
All of the Grants Given by the U.S. CHIPS Act
Intel, TSMC, and more have received billions in subsidies from the U.S. CHIPS Act in 2024.


All of the Grants Given by the U.S. CHIPS Act
This was originally posted on our Voronoi app. Download the app for free on iOS or Android and discover incredible data-driven charts from a variety of trusted sources.
This visualization shows which companies are receiving grants from the U.S. CHIPS Act, as of April 25, 2024. The CHIPS Act is a federal statute signed into law by President Joe Biden that authorizes $280 billion in new funding to boost domestic research and manufacturing of semiconductors.
The grant amounts visualized in this graphic are intended to accelerate the production of semiconductor fabrication plants (fabs) across the United States.
Data and Company Highlights
The figures we used to create this graphic were collected from a variety of public news sources. The Semiconductor Industry Association (SIA) also maintains a tracker for CHIPS Act recipients, though at the time of writing it does not have the latest details for Micron.
| Company | Federal Grant Amount | Anticipated Investment From Company |
|---|---|---|
| 🇺🇸 Intel | $8,500,000,000 | $100,000,000,000 |
| 🇹🇼 TSMC | $6,600,000,000 | $65,000,000,000 |
| 🇰🇷 Samsung | $6,400,000,000 | $45,000,000,000 |
| 🇺🇸 Micron | $6,100,000,000 | $50,000,000,000 |
| 🇺🇸 GlobalFoundries | $1,500,000,000 | $12,000,000,000 |
| 🇺🇸 Microchip | $162,000,000 | N/A |
| 🇬🇧 BAE Systems | $35,000,000 | N/A |
BAE Systems was not included in the graphic due to size limitations
Intel’s Massive Plans
Intel is receiving the largest share of the pie, with $8.5 billion in grants (plus an additional $11 billion in government loans). This grant accounts for 22% of the CHIPS Act’s total subsidies for chip production.
From Intel’s side, the company is expected to invest $100 billion to construct new fabs in Arizona and Ohio, while modernizing and/or expanding existing fabs in Oregon and New Mexico. Intel could also claim another $25 billion in credits through the U.S. Treasury Department’s Investment Tax Credit.
TSMC Expands its U.S. Presence
TSMC, the world’s largest semiconductor foundry company, is receiving a hefty $6.6 billion to construct a new chip plant with three fabs in Arizona. The Taiwanese chipmaker is expected to invest $65 billion into the project.
The plant’s first fab will be up and running in the first half of 2025, leveraging 4 nm (nanometer) technology. According to TrendForce, the other fabs will produce chips on more advanced 3 nm and 2 nm processes.
The Latest Grant Goes to Micron
Micron, the only U.S.-based manufacturer of memory chips, is set to receive $6.1 billion in grants to support its plans of investing $50 billion through 2030. This investment will be used to construct new fabs in Idaho and New York.

-

 Energy1 week ago
The World’s Biggest Nuclear Energy Producers
-

 Money2 weeks ago
Which States Have the Highest Minimum Wage in America?
-

 Technology2 weeks ago
Ranked: Semiconductor Companies by Industry Revenue Share
-

 Markets2 weeks ago
Ranked: The World’s Top Flight Routes, by Revenue
-

 Countries2 weeks ago
Population Projections: The World’s 6 Largest Countries in 2075
-

 Markets2 weeks ago
The Top 10 States by Real GDP Growth in 2023
-

 Demographics2 weeks ago
The Smallest Gender Wage Gaps in OECD Countries
-

 United States2 weeks ago
Where U.S. Inflation Hit the Hardest in March 2024