Markets
How Many Hours Americans Need to Work to Pay Their Mortgage
How Many Hours Americans Need to Work to Afford a Home
When it comes to the cost of living in cities, a general rule of thumb is that housing prices are much higher in the country’s economic and population hubs, especially in the cities along the coasts.
Particularly in recent years, prices have been pushed sky-high in places like New York City or San Francisco through a combination of limited supply of new homes, increasing demand, shifting demographics, and government regulations.
Putting it Into Perspective
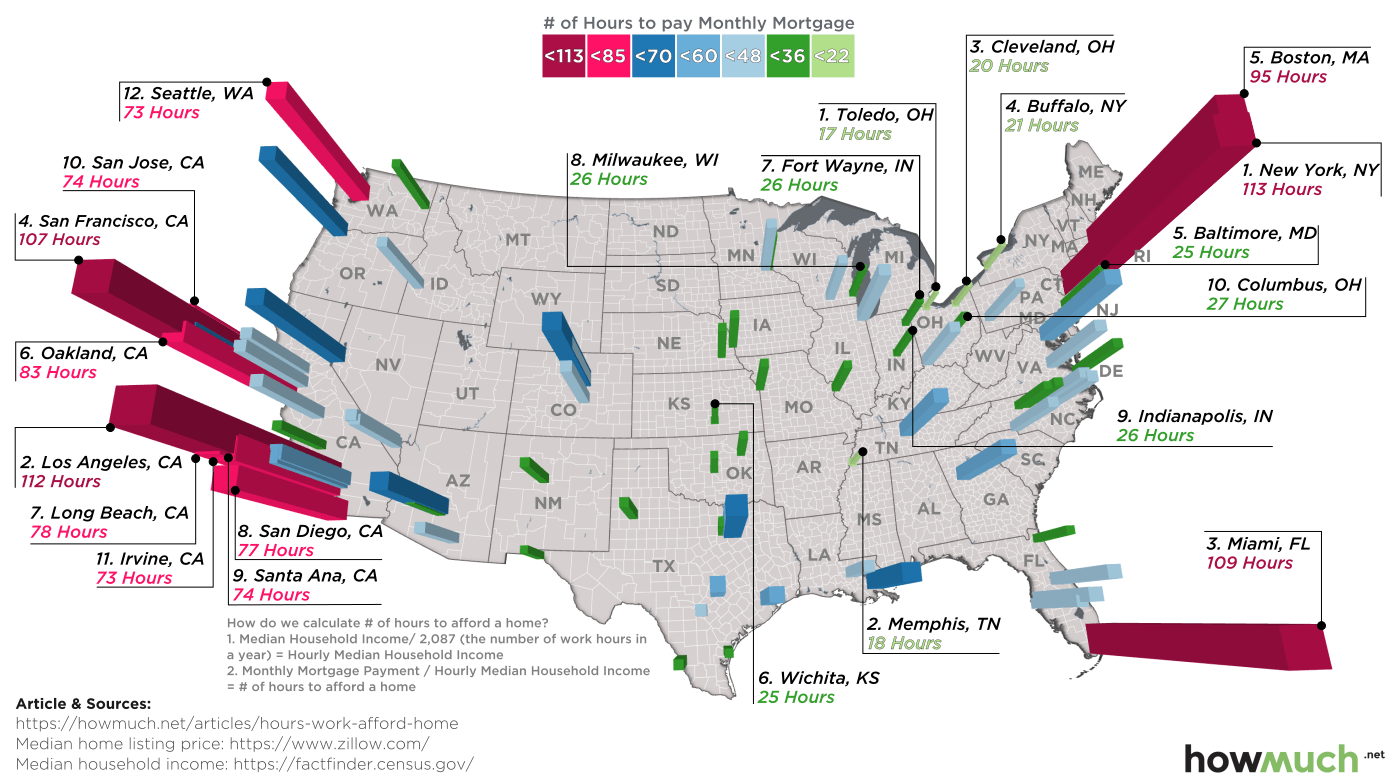
Today’s visualization from HowMuch.net applies a common denominator to compare 97 of the biggest cities in the United States. Using a measure of median household income against the average mortgage payment in each city, we get a gauge of how many hours must be worked each month just to pay down the house.
The visualization uses data from the U.S. Census for household income and Zillow for median home listing price, while calculating mortgage payments based on a standard 30-year term.
The Results
Using the above method to compare the amount of hours it takes to pay down a monthly mortgage, we see some interesting contrasts in the country.
Here are the five most expensive cities in the United States for housing:
| Rank | City | Median Income | Median Listing | Hours of Work to Pay Mortgage |
|---|---|---|---|---|
| #1 | New York City | $53,373 | $798,000 | 113.5 |
| #2 | Los Angeles | $50,205 | $748,000 | 112.4 |
| #3 | Miami | $31,051 | $449,000 | 109.4 |
| #4 | San Francisco | $82,294 | $1,150,000 | 106.7 |
| #5 | Boston | $55,777 | $699,000 | 94.7 |
With about 170 hours in a normal work month, the average people in these cities are spending 50% or more of their income just to pay down their mortgages. It’s worst in New York City and Los Angeles, where at least 65% of income is going towards housing.
These cities stand in stark contrast to the five cheapest cities based on hours of work needed:
| Rank | City | Median Income | Median Listing | Hours of Work to Pay Mortgage |
|---|---|---|---|---|
| #93 | Baltimore | $42,241 | $139,000 | 24.9 |
| #94 | Buffalo | $31,918 | $90,000 | 21.4 |
| #95 | Cleveland | $26,150 | $70,000 | 20.3 |
| #96 | Memphis | $36,445 | $88,500 | 18.4 |
| #97 | Toledo | $33,687 | $74,900 | 16.9 |
In a city like Memphis, TN it takes only 18.4 hours of work a month to pay down the average mortgage. That’s equal to only about 10% of monthly household income.
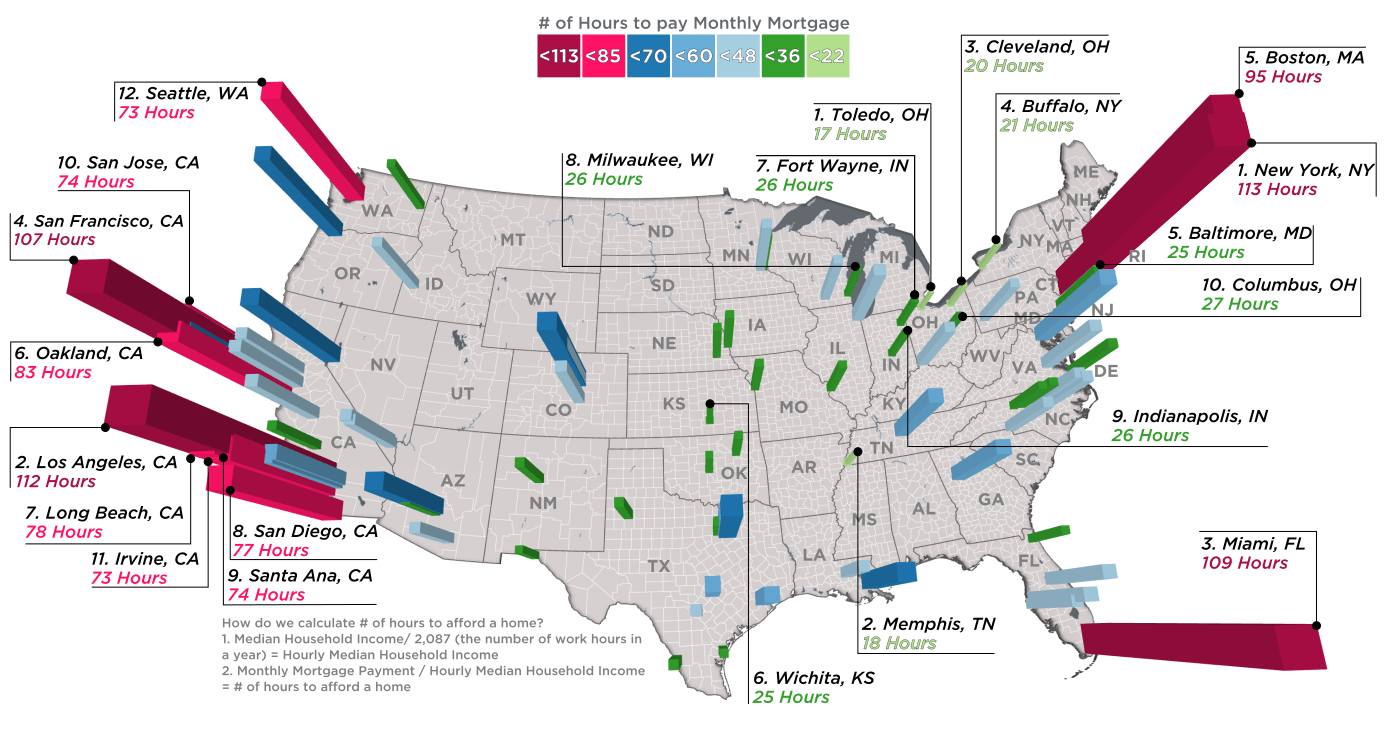
Coastal Disparity
Interestingly, even though coastal hubs have high prices relative to the cities in the middle of the country, they differ quite widely against each other. This discrepancy does not necessarily show in terms of ranking, but more in terms of the actual hours of work needed.
| Rank | City | Median Income | Median Listing | Hours of Work to Pay Mortgage |
|---|---|---|---|---|
| #1 | New York City | $53,373 | $798,000 | 113.5 |
| #2 | Los Angeles | $50,205 | $748,000 | 112.4 |
| #4 | San Francisco | $82,294 | $1,150,000 | 106.7 |
| #5 | Boston | $55,777 | $699,000 | 94.7 |
| #10 | San Jose | $84,647 | $825,000 | 73.5 |
| #12 | Seattle | $70,594 | $679,000 | 72.8 |
| #24 | Washington, D.C. | $70,848 | $550,000 | 58.9 |
Washington, D.C., for example, requires less than half the hours of work to pay down a mortgage than Los Angeles or New York City. Meanwhile, a popular west coast hub like Seattle only needs 72.8 hours in comparison to New York’s 113.5 hours.


Markets
Visualizing Global Inflation Forecasts (2024-2026)
Here are IMF forecasts for global inflation rates up to 2026, highlighting a slow descent of price pressures amid resilient global growth.


Visualizing Global Inflation Forecasts (2024-2026)
Global inflation rates are gradually descending, but progress has been slow.
Today, the big question is if inflation will decline far enough to trigger easing monetary policy. So far, the Federal Reserve has held rates for nine months amid stronger than expected core inflation, which excludes volatile energy and food prices.
Yet looking further ahead, inflation forecasts from the International Monetary Fund (IMF) suggest that inflation will decline as price pressures ease, but the path of disinflation is not without its unknown risks.
This graphic shows global inflation forecasts, based on data from the April 2024 IMF World Economic Outlook.
Get the Key Insights of the IMF’s World Economic Outlook
Want a visual breakdown of the insights from the IMF’s 2024 World Economic Outlook report?
This visual is part of a special dispatch of the key takeaways exclusively for VC+ members.
Get the full dispatch of charts by signing up to VC+.
The IMF’s Inflation Outlook
Below, we show the IMF’s latest projections for global inflation rates through to 2026:
| Year | Global Inflation Rate (%) | Advanced Economies Inflation Rate (%) | Emerging Market and Developing Economies Inflation Rate (%) |
|---|---|---|---|
| 2019 | 3.5 | 1.4 | 5.1 |
| 2020 | 3.2 | 0.7 | 5.2 |
| 2021 | 4.7 | 3.1 | 5.9 |
| 2022 | 8.7 | 7.3 | 9.8 |
| 2023 | 6.8 | 4.6 | 8.3 |
| 2024 | 5.9 | 2.6 | 8.3 |
| 2025 | 4.5 | 2.0 | 6.2 |
| 2026 | 3.7 | 2.0 | 4.9 |
After hitting a peak of 8.7% in 2022, global inflation is projected to fall to 5.9% in 2024, reflecting promising inflation trends amid resilient global growth.
While inflation has largely declined due to falling energy and goods prices, persistently high services inflation poses challenges to mitigating price pressures. In addition, the IMF highlights the potential risk of an escalating conflict in the Middle East, which could lead to energy price shocks and higher shipping costs.
These developments could negatively affect inflation scenarios and prompt central banks to adopt tighter monetary policies. Overall, by 2026, global inflation is anticipated to decline to 3.7%—still notably above the 2% target set by several major economies.
Adding to this, we can see divergences in the path of inflation between advanced and emerging economies. While affluent nations are forecast to see inflation edge closer to the 2% target by 2026, emerging economies are projected to have inflation rates reach 4.9%—falling closer to their pre-pandemic averages.
Get the Full Analysis of the IMF’s Outlook on VC+
This visual is part of an exclusive special dispatch for VC+ members which breaks down the key takeaways from the IMF’s 2024 World Economic Outlook.
For the full set of charts and analysis, sign up for VC+.

-

 Culture7 days ago
The World’s Top Media Franchises by All-Time Revenue
-

 Science2 weeks ago
Visualizing the Average Lifespans of Mammals
-

 Brands2 weeks ago
How Tech Logos Have Evolved Over Time
-

 Energy2 weeks ago
Ranked: The Top 10 EV Battery Manufacturers in 2023
-

 Demographics2 weeks ago
Countries With the Largest Happiness Gains Since 2010
-

 Economy2 weeks ago
VC+: Get Our Key Takeaways From the IMF’s World Economic Outlook
-

 Demographics2 weeks ago
The Countries That Have Become Sadder Since 2010
-

 Money1 week ago
Charted: Who Has Savings in This Economy?