Markets
What People Think of Globalization, by Country
View a high resolution version of this graphic
What People Think of Globalization, by Country
View the high resolution version of today’s graphic by clicking here.
More than in the past, the population is divided on whether globalization is a force for good or not.
In the aftermath of events like Brexit and the Trump election, it’s clear that there’s a growing movement of people that are skeptical about wider integration into the global economy and foreign cultures. While this countervailing force has always existed, only recently has it become powerful enough to change the outcomes of key elections and referendums.
But how big is this contingent of the population, and how does it differ in size from country to country?
The Survey
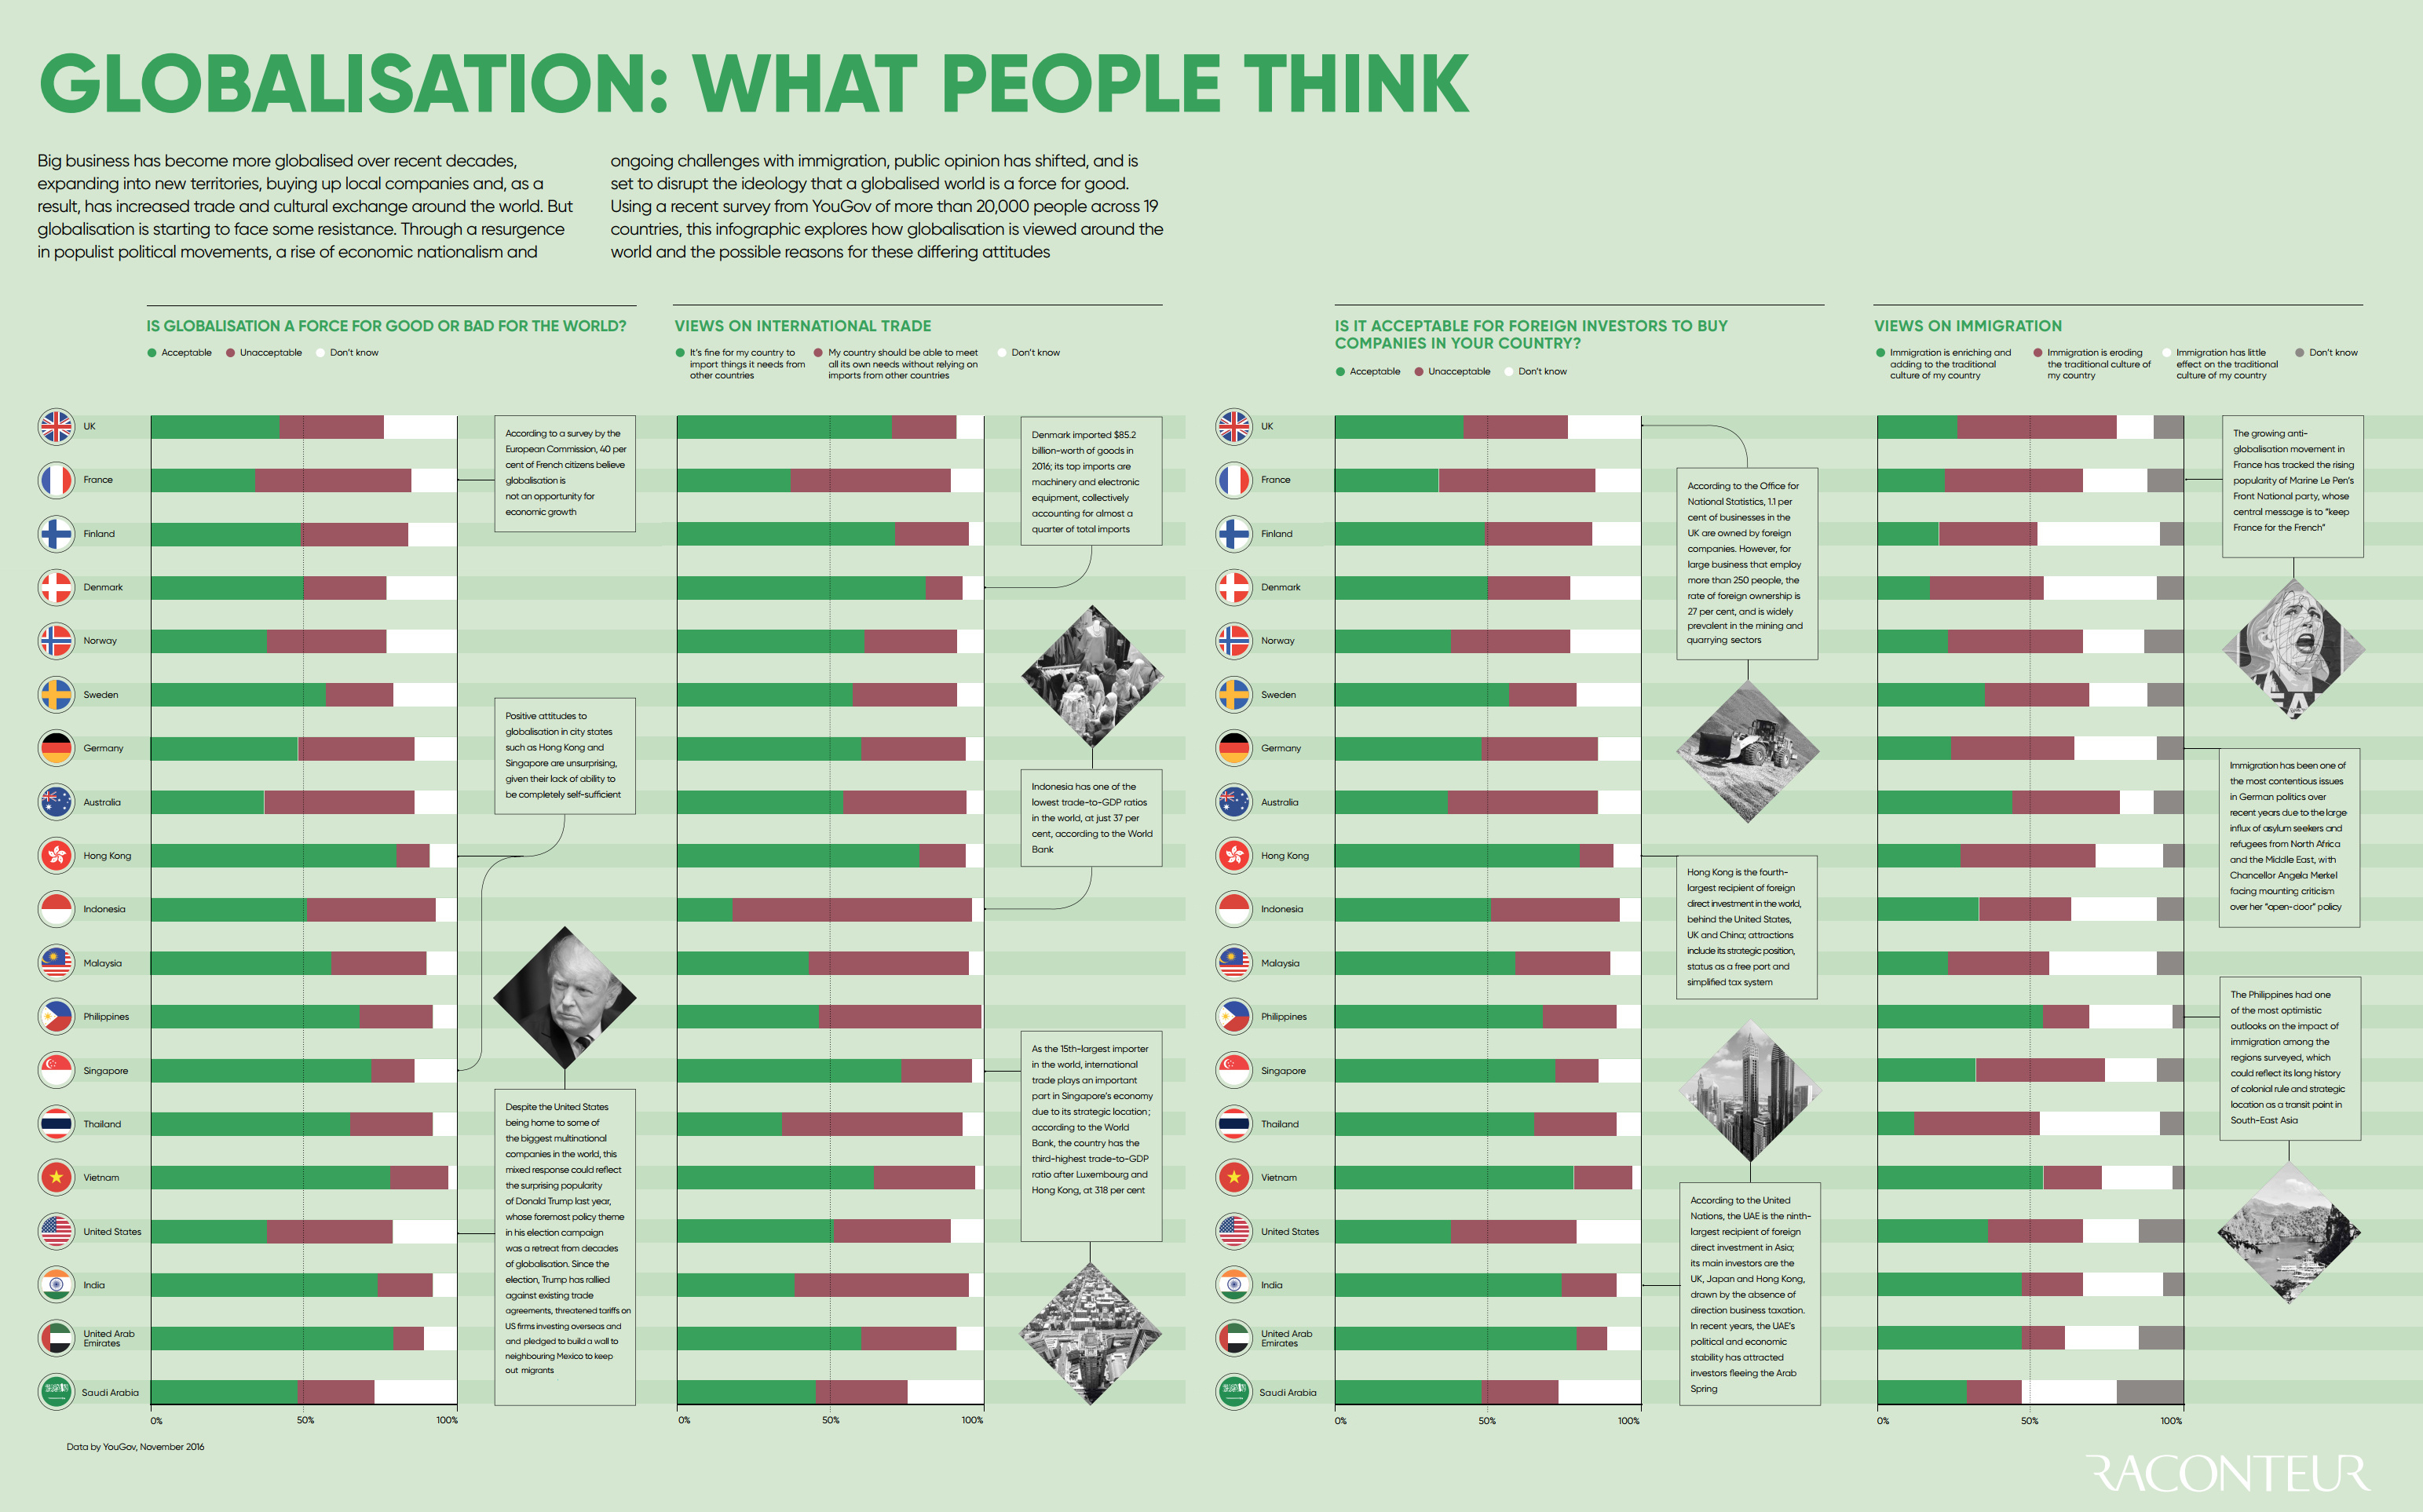
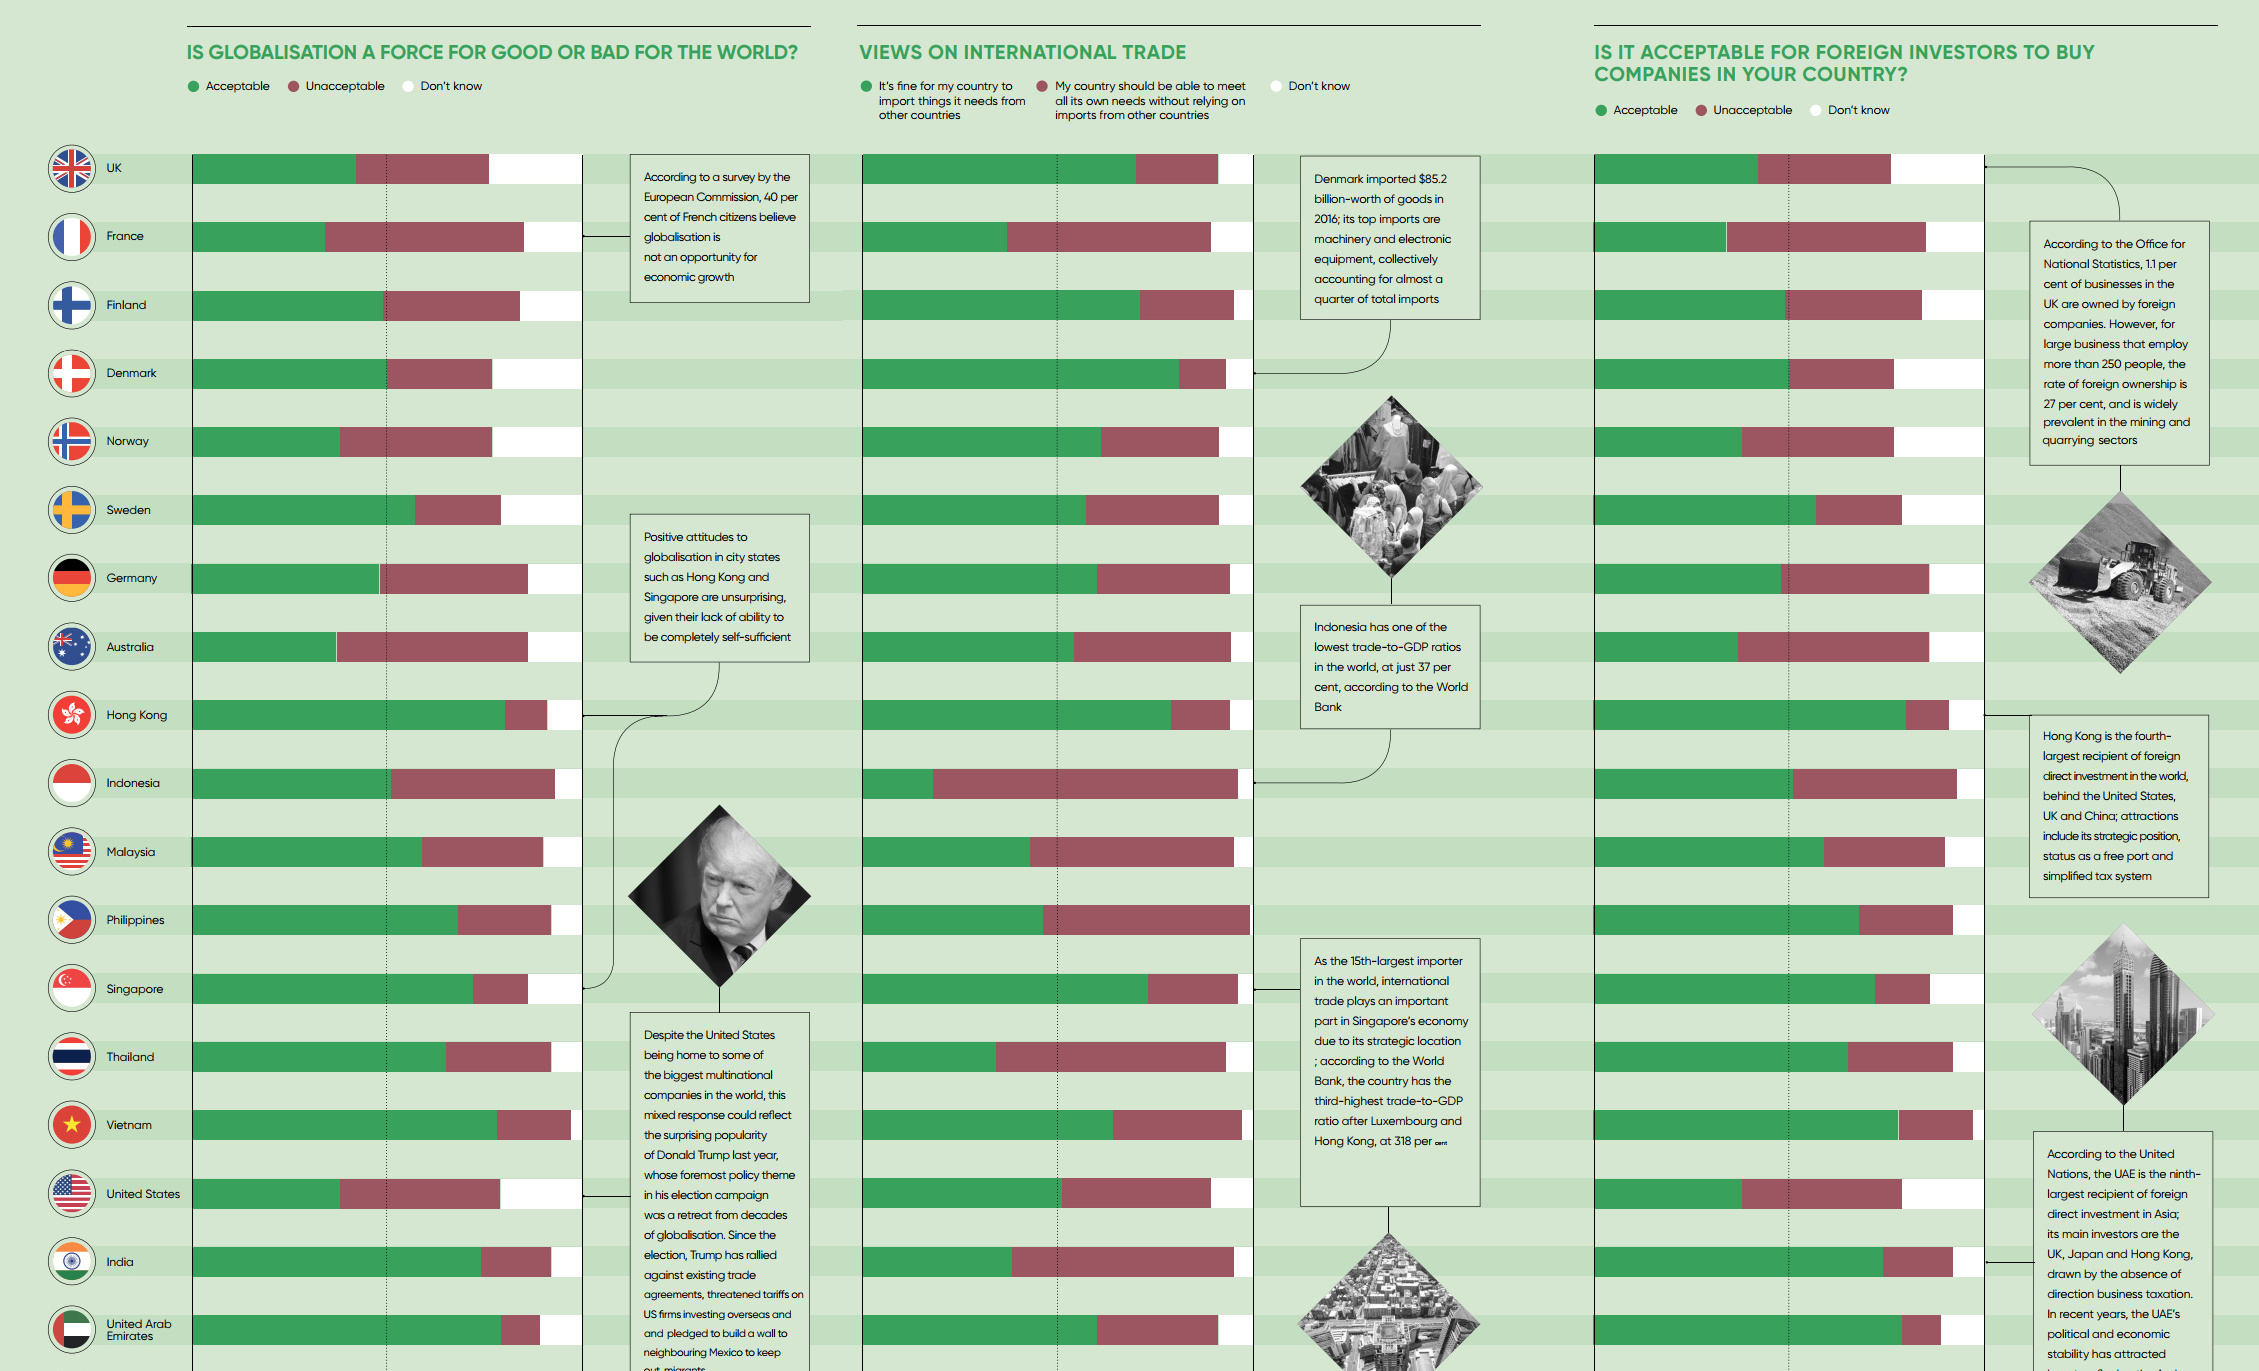
Today’s infographic from Raconteur highlights survey data on the topic of globalization for 19 countries.
The survey, published by YouGov just under a year ago, covers international trade, foreign direct investment, and the impact of immigration. Here is the highest level data, which focuses on globalization in general.
Question: “Overall, do you think globalization is a force for good or bad for the world?”
| Country | Force for good | Force for bad | Don't know |
|---|---|---|---|
| United Kingdom | 46% | 19% | 36% |
| France | 37% | 37% | 26% |
| Finland | 56% | 18% | 27% |
| Denmark | 68% | 15% | 17% |
| Norway | 49% | 23% | 27% |
| Sweden | 63% | 20% | 18% |
| Germany | 60% | 20% | 20% |
| Australia | 48% | 22% | 29% |
| Hong Kong | 63% | 21% | 16% |
| Indonesia | 72% | 13% | 15% |
| Malaysia | 73% | 10% | 17% |
| Philippines | 85% | 7% | 8% |
| Singapore | 71% | 12% | 17% |
| Thailand | 76% | 12% | 12% |
| Vietnam | 91% | 4% | 5% |
| United States | 40% | 27% | 33% |
| India | 83% | 7% | 10% |
| UAE | 69% | 13% | 18% |
| Saudi Arabia | 48% | 18% | 35% |
Note: get the data for all questions directly from YouGov here.
Differing Perspectives
Interestingly, support for globalization ranges from 37% (France) all the way to 91% (Vietnam), representing a very diverse array of attitudes towards the topic.
Based on these 19 countries, at least, the places that feel the most positive about globalization tend to be emerging markets such as the Philippines (85%), India (83%), and Indonesia (72%). These are countries where the pie is getting bigger at a rapid rate, as economies expand from access to increased global capital and trade.
The countries that seem the most skeptical seem to be more developed economically. In the United States, only 40% of respondents saw globalization as a force for good, while 27% saw it as a force for bad and a large portion of the population wasn’t sure (33%). The U.K. and Australia have similar numbers, with the aforementioned France having the lowest portion of respondents saying globalization is a force for good.
Though it’s true that these developed countries are showing skepticism, it’s also clear that the Western world is very split on the topic. European countries like Germany (60%), Denmark (68%), Sweden (63%), and Finland (56%) all saw a majority of respondents in favor of globalization.
This split in opinion is hard to reconcile, and it’s likely part of the reason that so many investors remain focused on geopolitical risk in the current environment.


Markets
The European Stock Market: Attractive Valuations Offer Opportunities
On average, the European stock market has valuations that are nearly 50% lower than U.S. valuations. But how can you access the market?


European Stock Market: Attractive Valuations Offer Opportunities
Europe is known for some established brands, from L’Oréal to Louis Vuitton. However, the European stock market offers additional opportunities that may be lesser known.
The above infographic, sponsored by STOXX, outlines why investors may want to consider European stocks.
Attractive Valuations
Compared to most North American and Asian markets, European stocks offer lower or comparable valuations.
| Index | Price-to-Earnings Ratio | Price-to-Book Ratio |
|---|---|---|
| EURO STOXX 50 | 14.9 | 2.2 |
| STOXX Europe 600 | 14.4 | 2 |
| U.S. | 25.9 | 4.7 |
| Canada | 16.1 | 1.8 |
| Japan | 15.4 | 1.6 |
| Asia Pacific ex. China | 17.1 | 1.8 |
Data as of February 29, 2024. See graphic for full index names. Ratios based on trailing 12 month financials. The price to earnings ratio excludes companies with negative earnings.
On average, European valuations are nearly 50% lower than U.S. valuations, potentially offering an affordable entry point for investors.
Research also shows that lower price ratios have historically led to higher long-term returns.
Market Movements Not Closely Connected
Over the last decade, the European stock market had low-to-moderate correlation with North American and Asian equities.
The below chart shows correlations from February 2014 to February 2024. A value closer to zero indicates low correlation, while a value of one would indicate that two regions are moving in perfect unison.
| EURO STOXX 50 | STOXX EUROPE 600 | U.S. | Canada | Japan | Asia Pacific ex. China |
|
|---|---|---|---|---|---|---|
| EURO STOXX 50 | 1.00 | 0.97 | 0.55 | 0.67 | 0.24 | 0.43 |
| STOXX EUROPE 600 | 1.00 | 0.56 | 0.71 | 0.28 | 0.48 | |
| U.S. | 1.00 | 0.73 | 0.12 | 0.25 | ||
| Canada | 1.00 | 0.22 | 0.40 | |||
| Japan | 1.00 | 0.88 | ||||
| Asia Pacific ex. China | 1.00 |
Data is based on daily USD returns.
European equities had relatively independent market movements from North American and Asian markets. One contributing factor could be the differing sector weights in each market. For instance, technology makes up a quarter of the U.S. market, but health care and industrials dominate the broader European market.
Ultimately, European equities can enhance portfolio diversification and have the potential to mitigate risk for investors.
Tracking the Market
For investors interested in European equities, STOXX offers a variety of flagship indices:
| Index | Description | Market Cap |
|---|---|---|
| STOXX Europe 600 | Pan-regional, broad market | €10.5T |
| STOXX Developed Europe | Pan-regional, broad-market | €9.9T |
| STOXX Europe 600 ESG-X | Pan-regional, broad market, sustainability focus | €9.7T |
| STOXX Europe 50 | Pan-regional, blue-chip | €5.1T |
| EURO STOXX 50 | Eurozone, blue-chip | €3.5T |
Data is as of February 29, 2024. Market cap is free float, which represents the shares that are readily available for public trading on stock exchanges.
The EURO STOXX 50 tracks the Eurozone’s biggest and most traded companies. It also underlies one of the world’s largest ranges of ETFs and mutual funds. As of November 2023, there were €27.3 billion in ETFs and €23.5B in mutual fund assets under management tracking the index.
“For the past 25 years, the EURO STOXX 50 has served as an accurate, reliable and tradable representation of the Eurozone equity market.”
— Axel Lomholt, General Manager at STOXX
Partnering with STOXX to Track the European Stock Market
Are you interested in European equities? STOXX can be a valuable partner:
- Comprehensive, liquid and investable ecosystem
- European heritage, global reach
- Highly sophisticated customization capabilities
- Open architecture approach to using data
- Close partnerships with clients
- Part of ISS STOXX and Deutsche Börse Group
With a full suite of indices, STOXX can help you benchmark against the European stock market.
Learn how STOXX’s European indices offer liquid and effective market access.

-

 Economy1 day ago
Economic Growth Forecasts for G7 and BRICS Countries in 2024
The IMF has released its economic growth forecasts for 2024. How do the G7 and BRICS countries compare?
-

 Markets1 week ago
U.S. Debt Interest Payments Reach $1 Trillion
U.S. debt interest payments have surged past the $1 trillion dollar mark, amid high interest rates and an ever-expanding debt burden.
-

 United States1 week ago
Ranked: The Largest U.S. Corporations by Number of Employees
We visualized the top U.S. companies by employees, revealing the massive scale of retailers like Walmart, Target, and Home Depot.
-

 Markets2 weeks ago
The Top 10 States by Real GDP Growth in 2023
This graphic shows the states with the highest real GDP growth rate in 2023, largely propelled by the oil and gas boom.
-

 Markets2 weeks ago
Ranked: The World’s Top Flight Routes, by Revenue
In this graphic, we show the highest earning flight routes globally as air travel continued to rebound in 2023.
-

 Markets2 weeks ago
Ranked: The Most Valuable Housing Markets in America
The U.S. residential real estate market is worth a staggering $47.5 trillion. Here are the most valuable housing markets in the country.


-

 Mining1 week ago
Gold vs. S&P 500: Which Has Grown More Over Five Years?
-
Markets2 weeks ago
Ranked: The Most Valuable Housing Markets in America
-

 Money2 weeks ago
Which States Have the Highest Minimum Wage in America?
-

 AI2 weeks ago
Ranked: Semiconductor Companies by Industry Revenue Share
-
Markets2 weeks ago
Ranked: The World’s Top Flight Routes, by Revenue
-

 Demographics2 weeks ago
Population Projections: The World’s 6 Largest Countries in 2075
-
Markets2 weeks ago
The Top 10 States by Real GDP Growth in 2023
-

 Demographics2 weeks ago
The Smallest Gender Wage Gaps in OECD Countries