Money
How Financially Literate Are You With Investing?
Are You Financially Literate?
If you’ve ever paid attention to any report on financial literacy from around the world, you’ll likely know that the results aren’t exactly awe-inspiring.
For example, according to one global survey, only about 33% of adults are financially literate.
Americans tend to fare better on average, but not as much as you might imagine. In fact, as we showed in our infographic on the Financial Literacy Problem, one ongoing survey actually sees average U.S. performance slowly dropping over time.
It raises the question: what do people actually know about money, investing, and wealth?
Investment Literacy
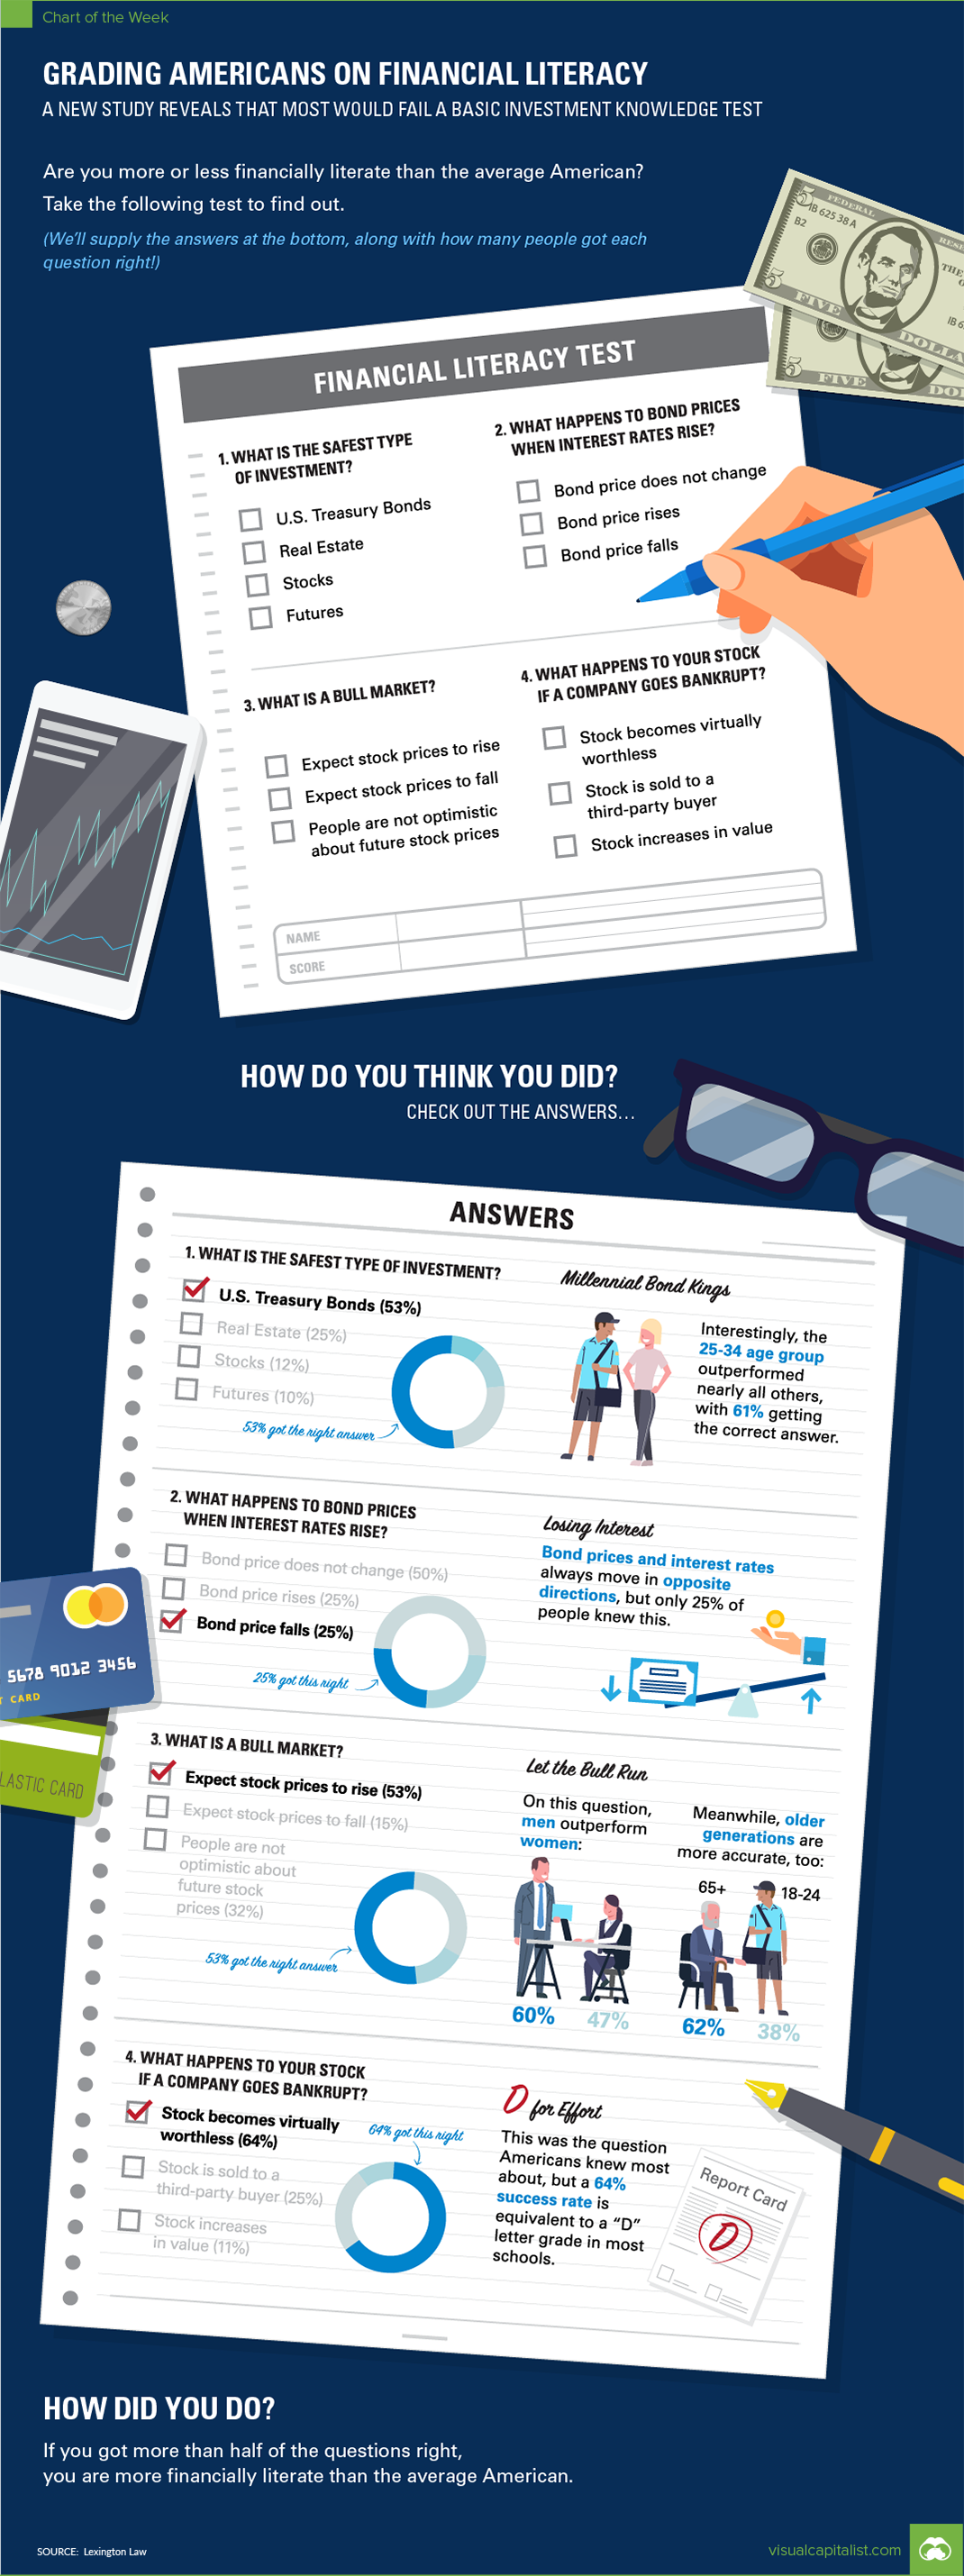
A recent poll by Lexington Law aimed to get a sense of U.S. financial literacy, with a focus on basic investment knowledge on stocks, bonds, and building a safe portfolio.
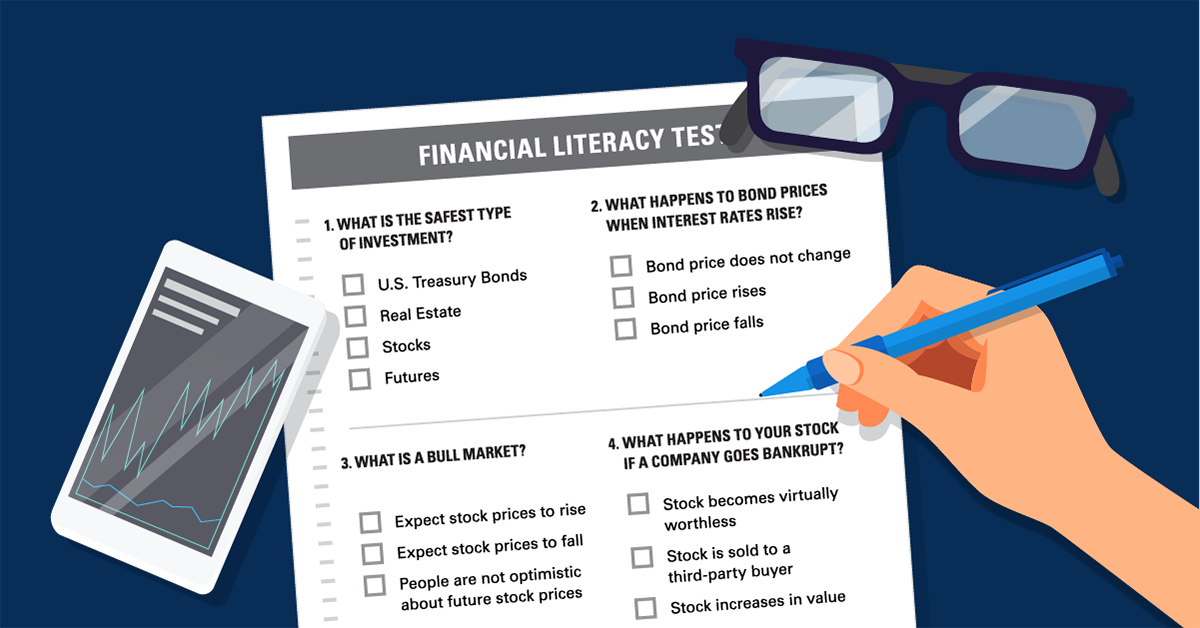
Specifically, it asked 4,000 Americans four different multiple choice questions:
- What is the safest investment type?
- What happens to bond prices when interest rates rise?
- What is a bull market?
- What happens to your stock if a company goes bankrupt?
If you think you know the answers to even two of these questions, you are off to a good start!
The survey ultimately found that the average score on this test was 48.8% – meaning that Americans get slightly fewer than two questions correct on average.
Cheat Sheet
Question #1: Safest Investment
Based on the options provided on the multiple choice, the correct answer was Treasury Bonds. Roughly 53% of Americans would get this right, if asked.
Question #2: Bond Prices
Only 25% of respondents said that bond prices would decrease if interest rates rise, which is the correct answer. To be fair, this relationship is somewhat counterintuitive.
Question #3: Bull Market
With the current bull market becoming the longest in history this month, this terminology has been all over the news. That said, just 53% of respondents understood a bull market to be a period in which stock prices are expected to rise.
Question #4: Bankruptcy
If you own a stock and the company goes bankrupt, what happens? Interestingly, people fared best on this question, with 64% realizing that the stock becomes “virtually worthless”. It’s worth noting, however, that a 64% success rate is still the grading equivalent of a “D”.
How did you do on this test – are you financially literate about investments? Where did you go wrong?
If you need to brush up on investing knowledge, don’t forget to visit our Wealth 101 project that features easy-to-use infographics about personal finance topics.


Wealth
Charted: Which Country Has the Most Billionaires in 2024?
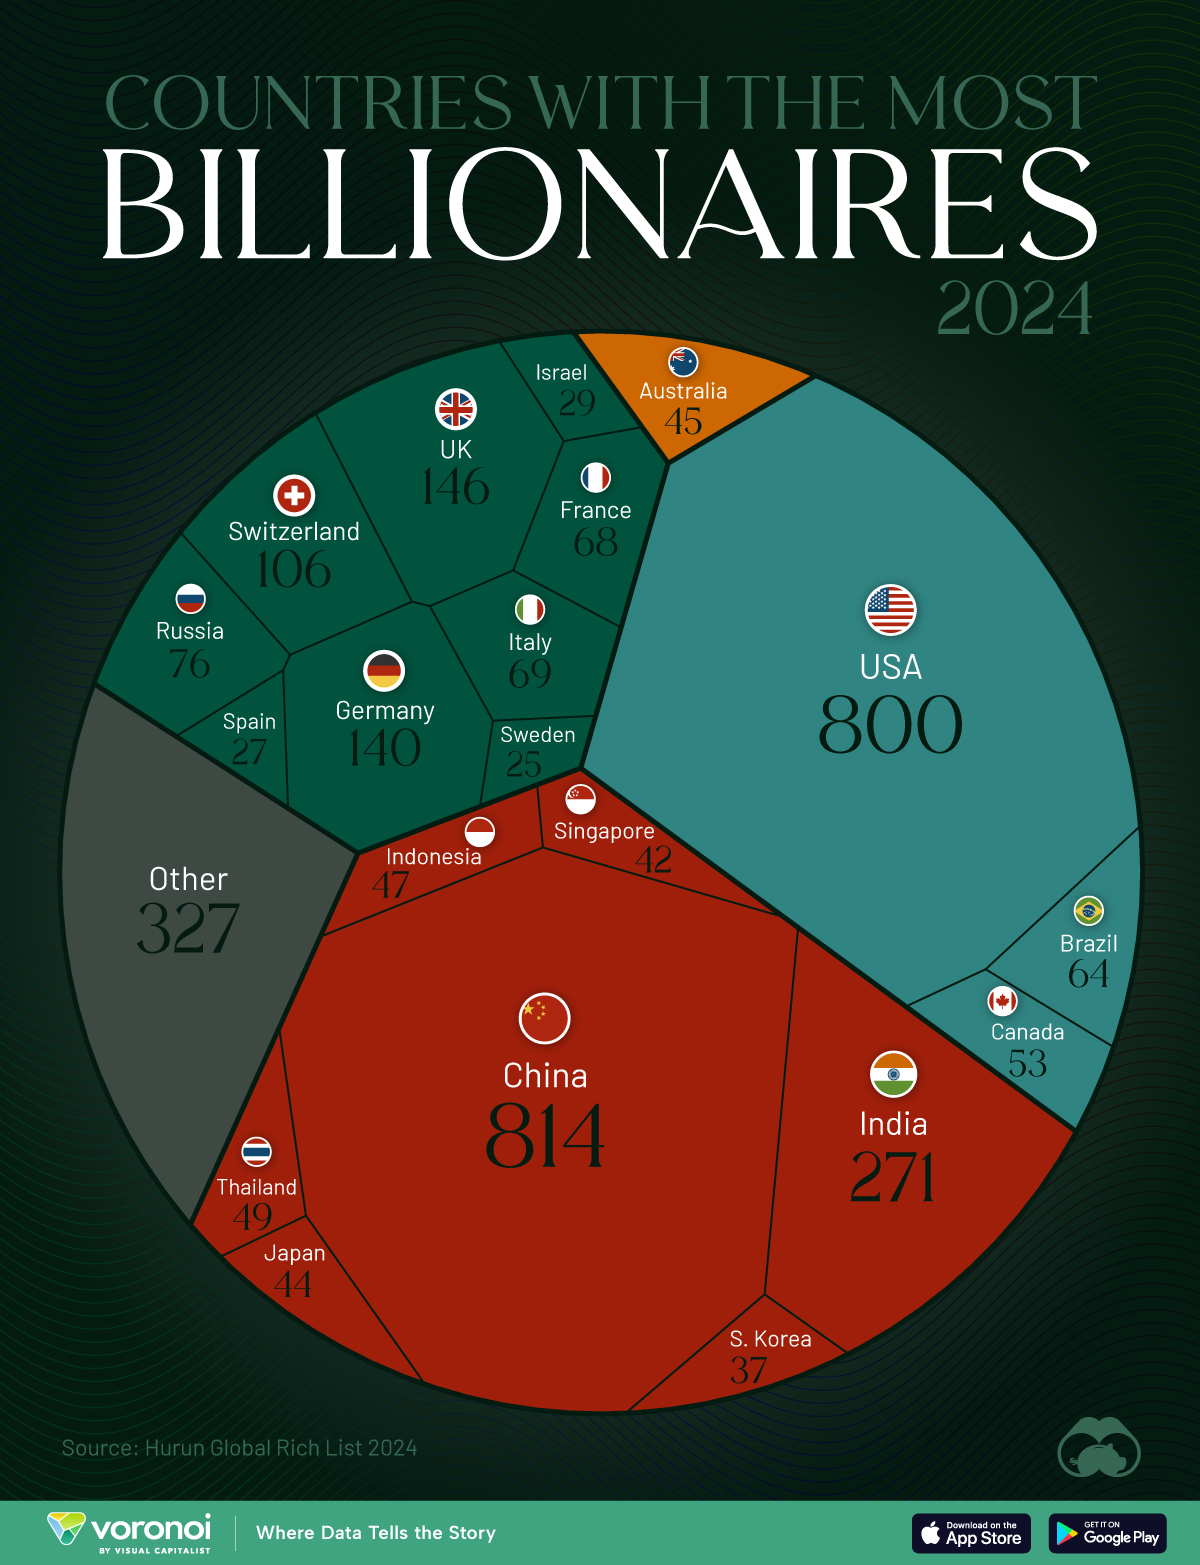
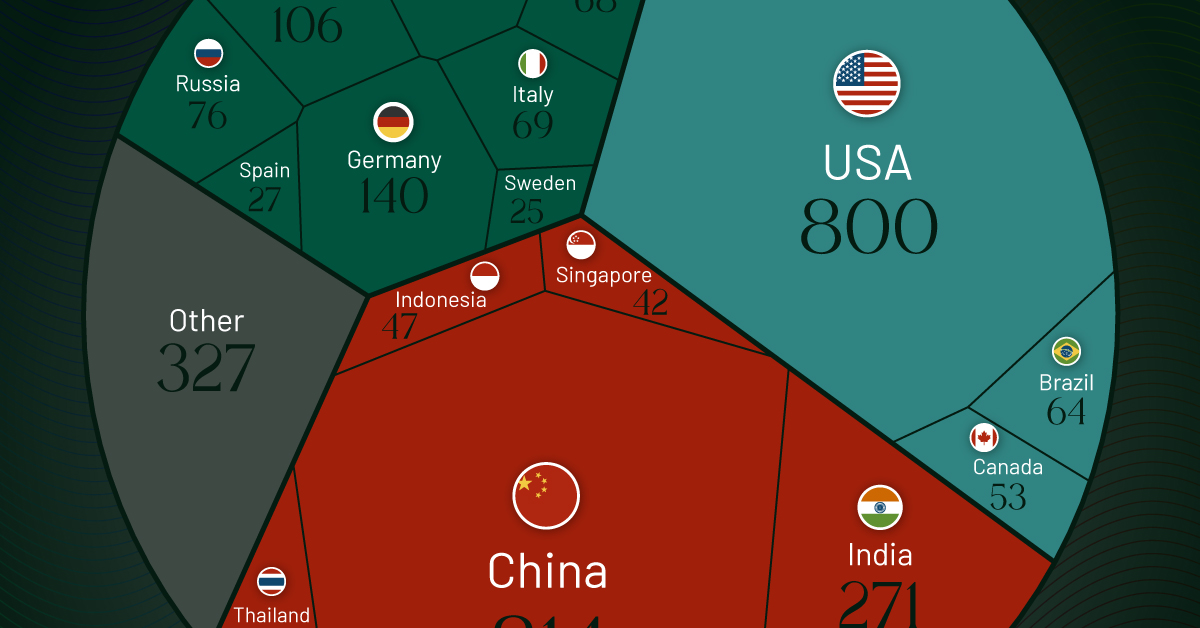
According to the annual Hurun Global Rich List, the U.S. and China are home to nearly half of the world’s 3,279 billionaires in 2024.
Charted: Which Country Has the Most Billionaires in 2024?
This was originally posted on our Voronoi app. Download the app for free on iOS or Android and discover incredible data-driven charts from a variety of trusted sources.
The world has always had people with incredible wealth: from Roman emperors to John D. Rockefeller who became the world’s first billionaire in measurable dollars. But where do the very wealthiest people live right now?
We visualize the countries with the most billionaires in 2024, sourced from the annual Hurun Global Rich list. A country and city aggregate is also available here.
A caveat to this data. Total wealth estimates are notoriously difficult to get right, and different sources can vary in their billionaire data. For example, Forbes, switches ranks for the U.S. and China, though the overall top three remain the same.
Forbes also has Bernard Arnault as the current richest individual, while Hurun places Elon Musk atop the ranks. Nevertheless, their overall top 10 is similar with a few ranking differences.
Ranked: Countries with the Most Billionaires in 2024
China has 814 billionaires, the most in the world, according to the Hurun Global Rich List 2024. Despite holding on to the top spot, China lost 155 billionaires year-over-year, while the U.S. gained 109. The gap between the two countries has now reduced to just 14 billionaires.
| Rank | Country | Billionaires | Change YoY |
|---|---|---|---|
| 1 | 🇨🇳 China | 814 | -155 |
| 2 | 🇺🇸 U.S. | 800 | +109 |
| 3 | 🇮🇳 India | 271 | +84 |
| 4 | 🇬🇧 UK | 146 | +12 |
| 5 | 🇩🇪 Germany | 140 | -4 |
| 6 | 🇨🇭 Switzerland | 106 | +6 |
| 7 | 🇷🇺 Russia | 76 | +6 |
| 8 | 🇮🇹 Italy | 69 | +11 |
| 9 | 🇫🇷 France | 68 | -4 |
| 10 | 🇧🇷 Brazil | 64 | +13 |
| 11 | 🇨🇦 Canada | 53 | +8 |
| 12 | 🇹🇭 Thailand | 49 | +3 |
| 13 | 🇮🇩 Indonesia | 47 | +12 |
| 14 | 🇦🇺 Australia | 45 | 0 |
| 15 | 🇯🇵 Japan | 44 | +12 |
| 16 | 🇸🇬 Singapore | 42 | +5 |
| 17 | 🇰🇷 South Korea | 37 | +4 |
| 18 | 🇮🇱 Israel | 29 | +9 |
| 19 | 🇪🇸 Spain | 27 | +1 |
| 20 | 🇸🇪 Sweden | 25 | -2 |
| N/A | 🌍 Other | 327 | N/A |
Together, the U.S. and China account for nearly half of the 3,279 billionaires globally, leagues ahead of closest peers, #3 India (271) and #4 UK (146).
Collectively however, European countries account for six of the top 10 and eight of the top 20 countries with the most billionaires.
Naturally, the world’s largest economies tend to be overrepresented on billionaire counts, as they provide more opportunities for wealth creation.
Switzerland, Singapore, and Sweden are outliers in this regard, with only one of them making the top 20 economies by total gross domestic product.
All three countries are perceived to have high tax rates, generally not conducive to amassing wealth. But perceptions can be misleading. Sweden, for example, has no inheritance tax, a flat rate on capital gains, and a corporate tax rate at 21%.

-

 Lithium6 days ago
Ranked: The Top 10 EV Battery Manufacturers in 2023
-

 Green2 weeks ago
Top Countries By Forest Growth Since 2001
-

 United States2 weeks ago
Ranked: The Largest U.S. Corporations by Number of Employees
-

 Maps2 weeks ago
The Largest Earthquakes in the New York Area (1970-2024)
-

 Green2 weeks ago
Ranked: The Countries With the Most Air Pollution in 2023
-

 Green2 weeks ago
Ranking the Top 15 Countries by Carbon Tax Revenue
-

 Markets2 weeks ago
U.S. Debt Interest Payments Reach $1 Trillion
-

 Mining2 weeks ago
Gold vs. S&P 500: Which Has Grown More Over Five Years?