Markets
Visualizing the Decline of Freedom Over 12 Consecutive Years
Visualizing the Decline of Freedom Over 12 Consecutive Years
The Chart of the Week is a weekly Visual Capitalist feature on Fridays.
Like many other things in this world, the amount of freedom that people have ebbs and flows with time.
In general, it can be argued that political and economic freedoms have been increasing steadily since The Enlightenment – but of course, there are always shorter corrections along the way where freedom seems to spiral downwards in the interim.
Right now, we’re in one of those ruts, and global freedom has consecutively declined for a 12 year period.
Democracy in Crisis
Freedom in the World, a report published every year since 1973, attempts to measure civil liberties and political rights around the world. It’s put together by Freedom House, a non-governmental organization based in the United States.
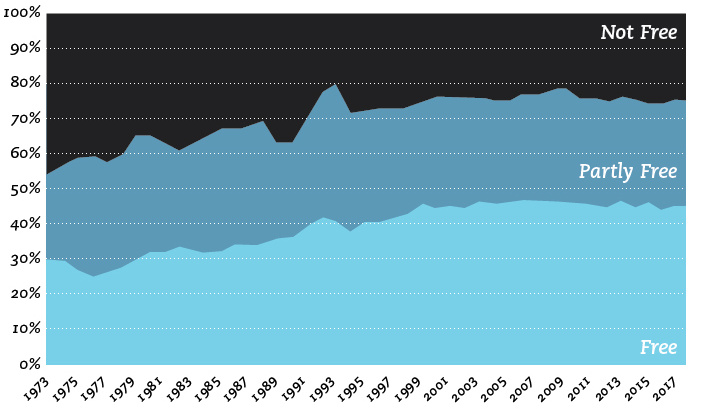
According to their index, here is the share of “free” countries globally between 1973-2018:
This year’s report for 2018 is entitled “Democracy in Crisis”, and it sounds the alarm on eroding freedom throughout the world.
Falling Scores
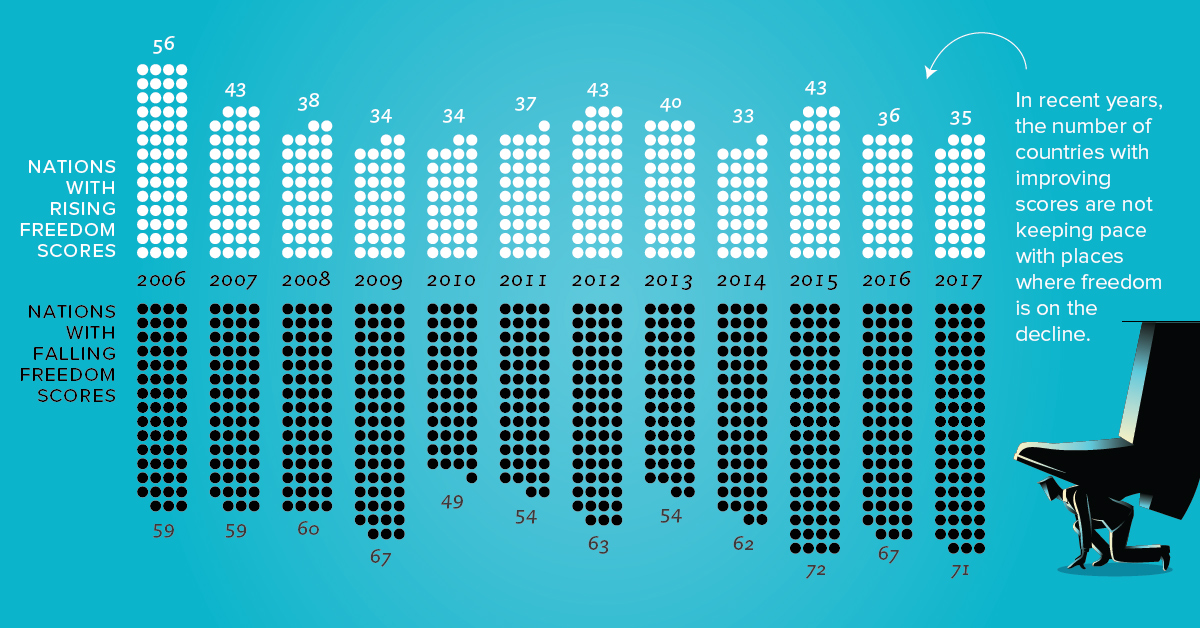
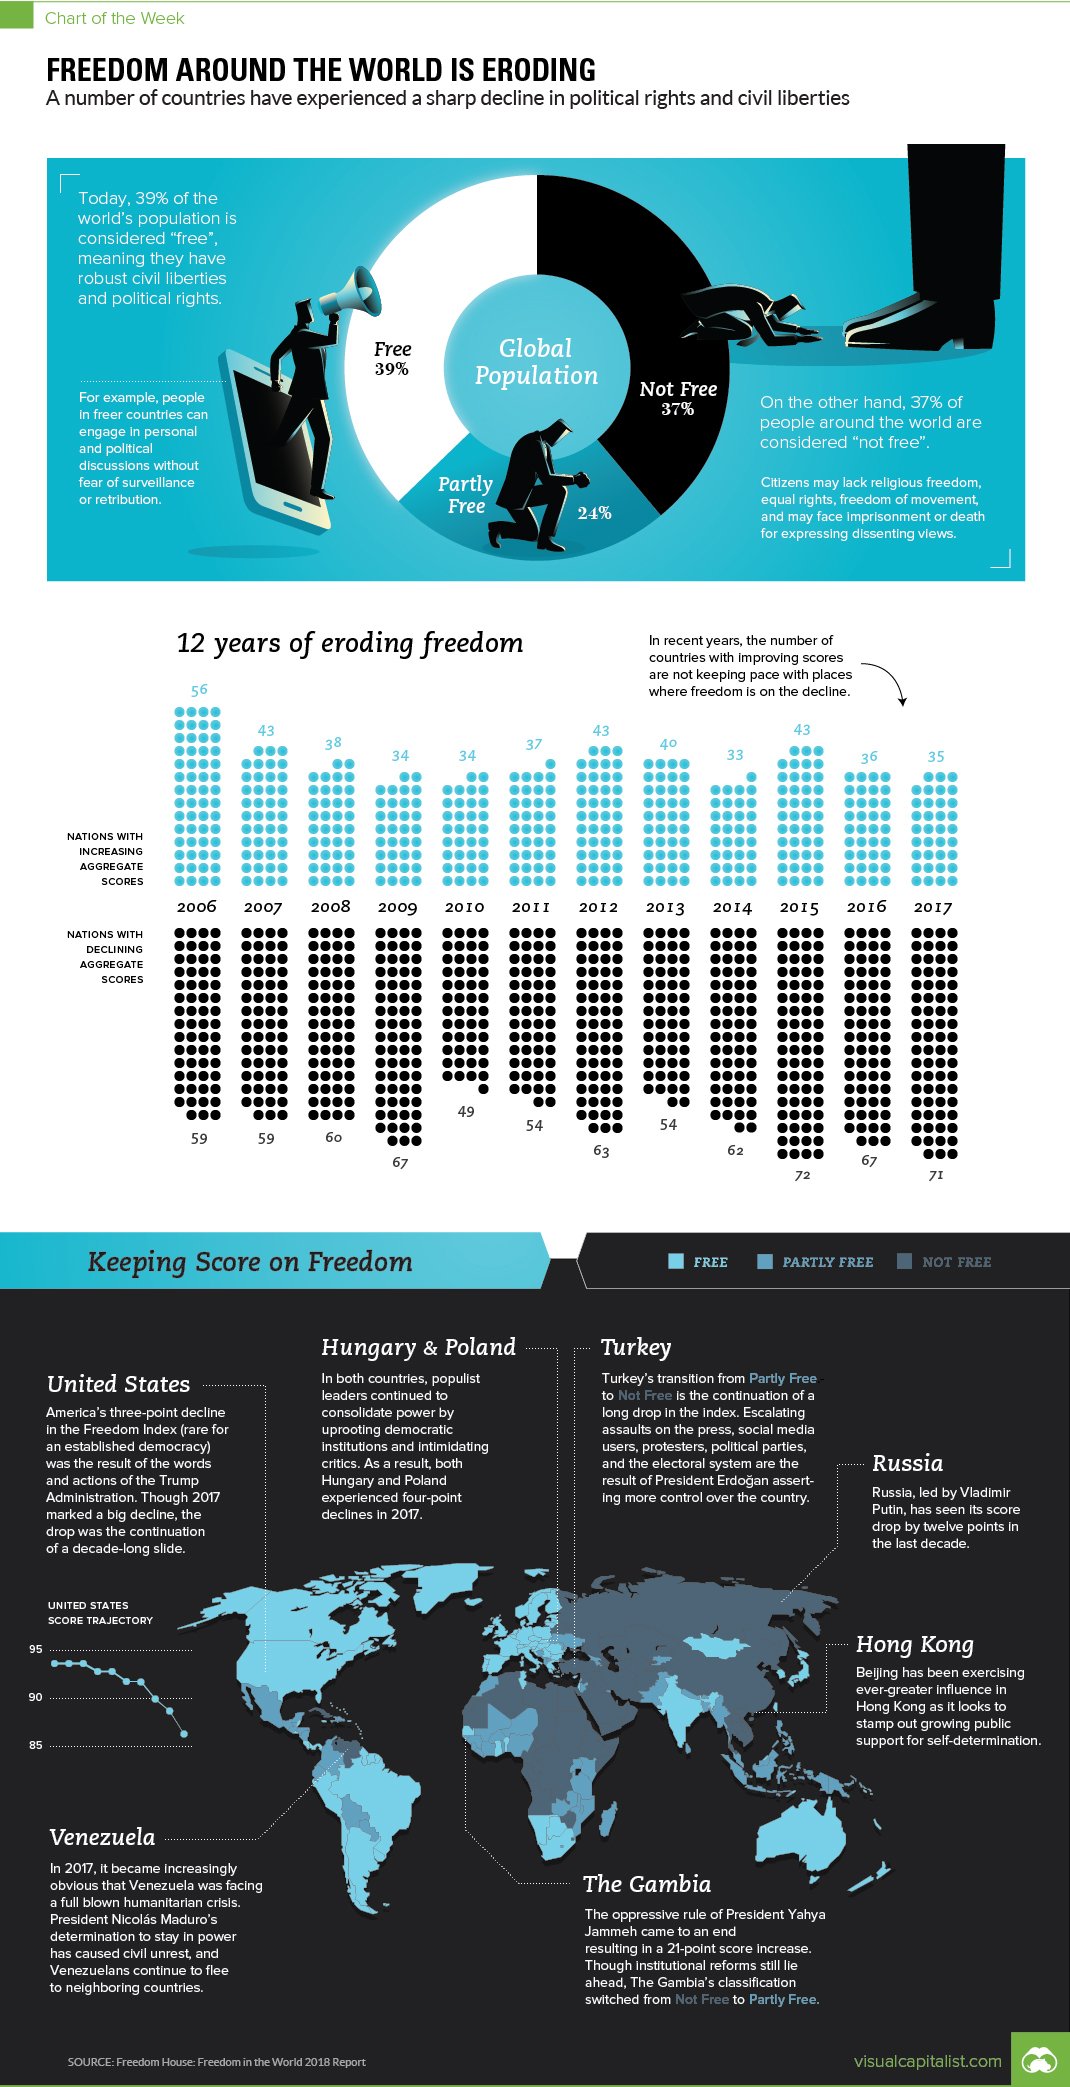
While the number of “free” countries is holding fairly steady at close to 45%, there is a clear downtrend with the scores of the countries themselves.
In 2017, for example, there were 71 countries that had net declines in score, while only 35 had net increases. This makes for a differential of -36, which is the widest gap during the 12 year downtrend.
| Year | Improved | Declined | Differential |
|---|---|---|---|
| 2006 | 56 | 59 | -3 |
| 2007 | 43 | 59 | -16 |
| 2008 | 38 | 60 | -22 |
| 2009 | 34 | 67 | -33 |
| 2010 | 34 | 49 | -15 |
| 2011 | 37 | 54 | -17 |
| 2012 | 43 | 63 | -20 |
| 2013 | 40 | 54 | -14 |
| 2014 | 33 | 62 | -29 |
| 2015 | 43 | 72 | -29 |
| 2016 | 36 | 67 | -31 |
| 2017 | 35 | 71 | -36 |
Why do scores continue to decline?
Here are some of the specific examples, cited by the report:
- The erosion of democratic norms in the U.S., which is actually the extension of a seven year trend
- The expansion of influence from key autocracies, particularly Russia and China
- Turkey’s transition from “Partly Free” to “Not Free” – the result of President Erdoğan asserting more control over the country
- Big drops in the scores of European countries like Poland and Hungary, where populist leaders are consolidating power
- Another drop in Venezuela’s score, as the country undergoes a full-blown humanitarian crisis
- A recent backslide in the scores in Arab Spring countries – even in Tunisia, which was heralded as a democratic success story
For much more in-depth reading, here is a link to the full report PDF.
Markets
The World’s Fastest Growing Emerging Markets (2024-2029 Forecast)
Here are the emerging markets with the fastest projected growth rates over the next five years based on analysis from the IMF.
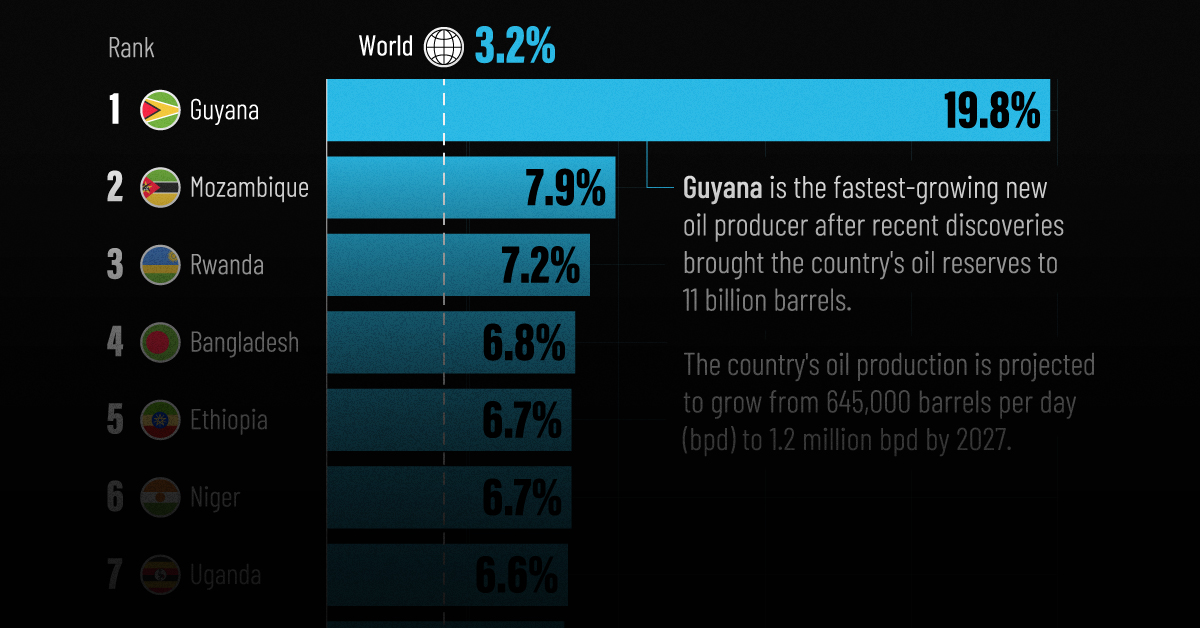
The World’s Fastest Growing Emerging Markets (2024-2029)
Large emerging markets are forecast to play a greater role in powering global economic growth in the future, driven by demographic shifts and a growing consumer class.
At the same time, many smaller nations are projected to see their economies grow at double the global average over the next five years due to rich natural resource deposits among other factors. That said, elevated debt levels do present risks to future economic activity.
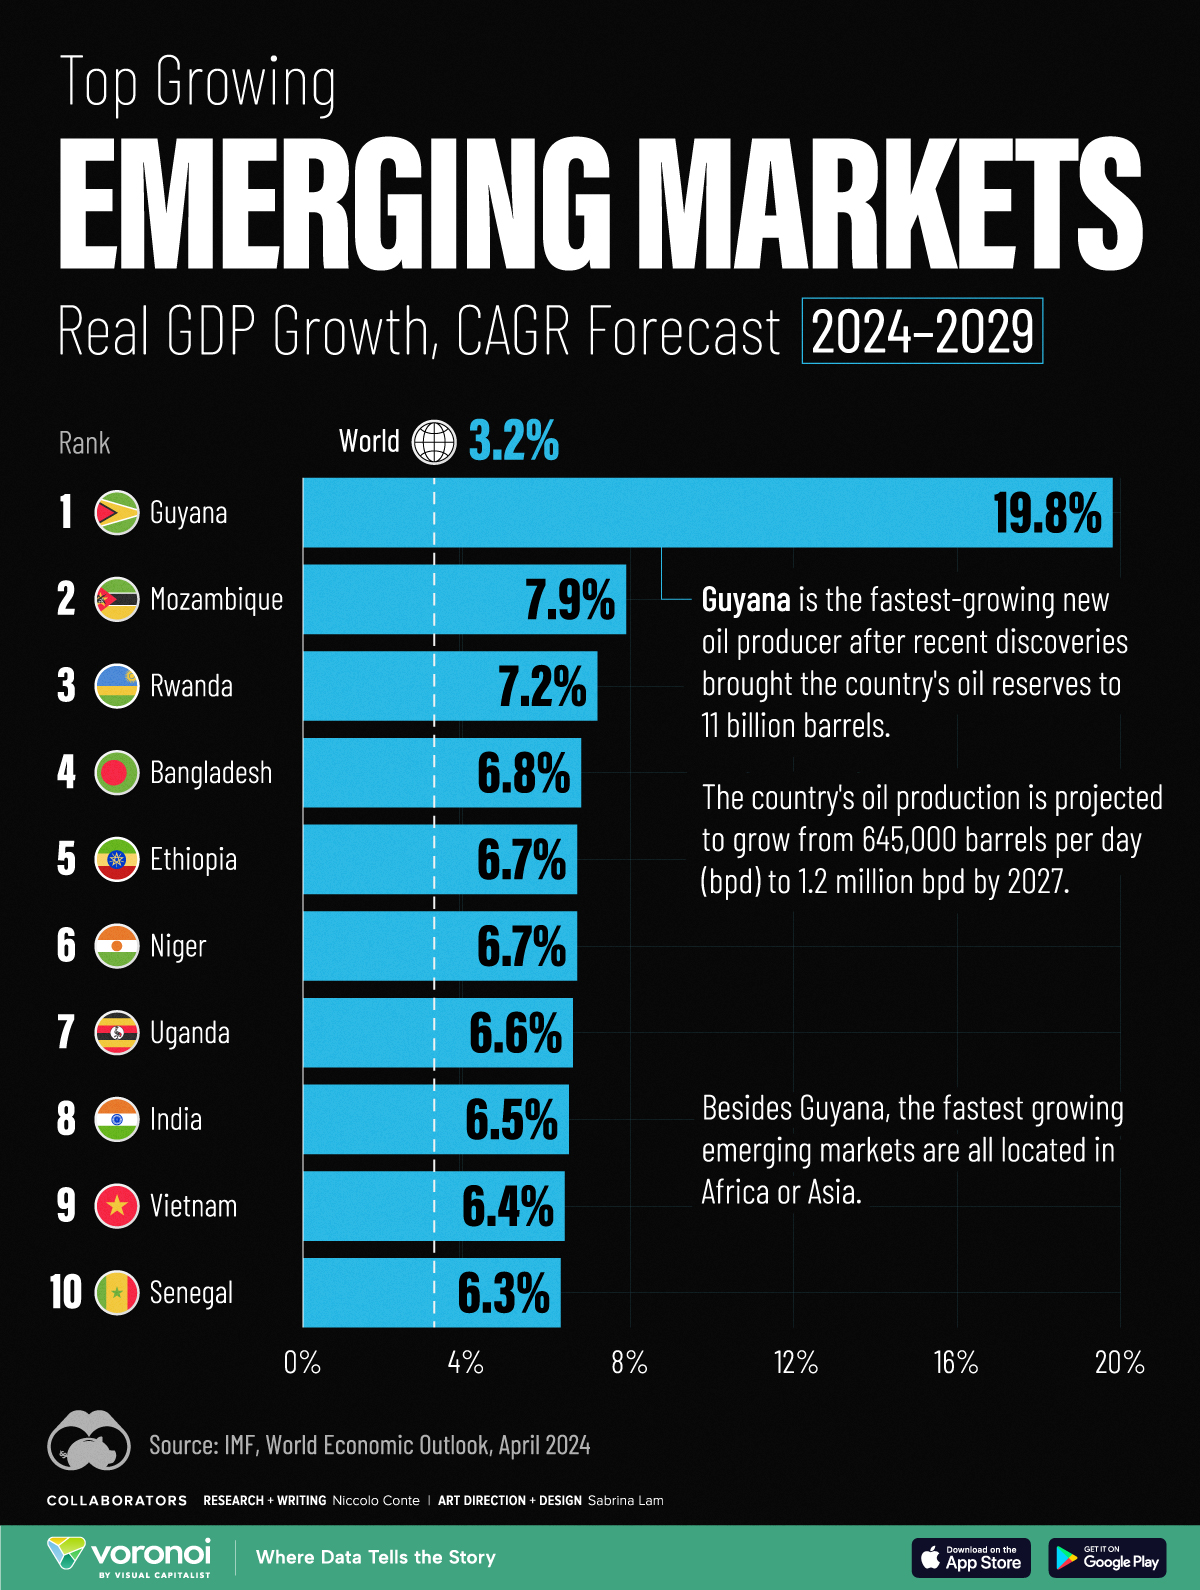
This graphic shows the emerging markets with the fastest projected growth through to 2029, based on data from the International Monetary Fund’s 2024 World Economic Outlook.
Get the Key Insights of the IMF’s World Economic Outlook
Want a visual breakdown of the insights from the IMF’s 2024 World Economic Outlook report?
This visual is part of a special dispatch of the key takeaways exclusively for VC+ members.
Get the full dispatch of charts by signing up to VC+.
Top 10 Emerging Markets
Here are the fastest-growing emerging economies, based on real GDP compound annual growth rate (CAGR) forecasts over the period of 2024-2029:
| Rank | Country | Projected CAGR (2024-2029) |
|---|---|---|
| 1 | 🇬🇾 Guyana | 19.8% |
| 2 | 🇲🇿 Mozambique | 7.9% |
| 3 | 🇷🇼 Rwanda | 7.2% |
| 4 | 🇧🇩 Bangladesh | 6.8% |
| 5 | 🇪🇹 Ethiopia | 6.7% |
| 6 | 🇳🇪 Niger | 6.7% |
| 7 | 🇺🇬 Uganda | 6.6% |
| 8 | 🇮🇳 India | 6.5% |
| 9 | 🇻🇳 Vietnam | 6.4% |
| 10 | 🇸🇳 Senegal | 6.3% |
As South America’s third-smallest nation by land area, Guyana is projected to be the world’s fastest growing economy from now to 2029.
This is thanks to a significant discovery of oil deposits in 2015 by ExxonMobil, which has propelled the country’s economy to grow by fourfold over the last five years alone. By 2028, the nation of just 800,000 people is projected to have the highest crude oil production per capita, outpacing Kuwait for the first time.
Bangladesh, where 85% of exports are driven by the textiles industry, is forecast to see the strongest growth in Asia. In fact, over the last 30 years, the country of 170 million people has not had a single year of negative growth.
In eighth place overall is India, projected to achieve a 6.5% CAGR in real GDP through to 2029. This growth is forecast to be fueled by population trends, public investment, and strong consumer demand.
Get the Full Analysis of the IMF’s Outlook on VC+
This visual is part of an exclusive special dispatch for VC+ members which breaks down the key takeaways from the IMF’s 2024 World Economic Outlook.
For the full set of charts and analysis, sign up for VC+.
-

 Green6 days ago
The Carbon Footprint of Major Travel Methods
-

 Misc2 weeks ago
How Hard Is It to Get Into an Ivy League School?
-

 Debt2 weeks ago
How Debt-to-GDP Ratios Have Changed Since 2000
-

 Sports2 weeks ago
The Highest Earning Athletes in Seven Professional Sports
-

 Science2 weeks ago
Visualizing the Average Lifespans of Mammals
-

 Brands2 weeks ago
How Tech Logos Have Evolved Over Time
-

 Energy1 week ago
Ranked: The Top 10 EV Battery Manufacturers in 2023
-

 Demographics1 week ago
Countries With the Largest Happiness Gains Since 2010

