Mining
Commodities: To Short, or Not to Short?
![Commodities: To Short, or Not to Short? [Chart]](https://www.visualcapitalist.com/wp-content/uploads/2016/01/commodities-to-short-chart.png)
Commodities: To Short, or Not to Short? [Chart]
Comparing “Dogs of the Dow” inspired strategies over the last decade
The Chart of the Week is a weekly Visual Capitalist feature on Fridays.
Over the last week, we have received a wide variety of reactions from our audience regarding the Periodic Table of Commodity Returns that we published last Thursday from our friends at U.S. Global Investors.
The most interesting email came from Brad Farquhar, the Executive Vice President and CFO of Input Capital, a Canadian-based agricultural streaming company. In his email, Brad attached a chart summarizing the cumulative returns using a long/short commodity strategy where he imagined going long on the worst performing commodity of the previous year, while shorting the best performing commodity.
For example, the long-only portfolio would have invested in natural gas in 2007, because gas was the worst performing commodity in 2006 with a -43.9% return. The short-only strategy would have shorted nickel in 2007 (betting that nickel would drop in price) because it was the best performer of 2007 with 145.5% returns.
On a cumulative basis (re-investing money from each year), the long-only strategy returned -0.9% compound annualized growth between 2007 and 2015, while the short-only strategy brought in 12.4% annualized returns.
A 50/50 hybrid (50% long, and 50% short) gave us the equivalent of 9.6% returns each year.
Our Variation
Inspired by Brad’s analysis, we did our own variation of this “Dogs of the Dow” type of exercise to look at these long and short commodity portfolios in a slightly different light.
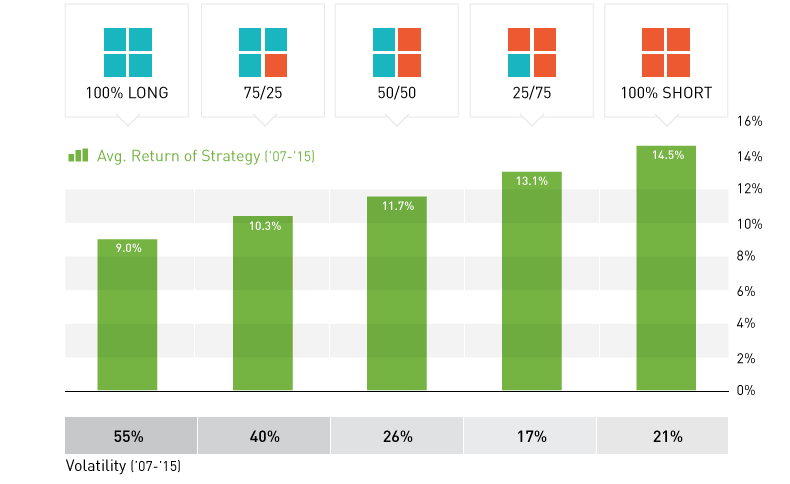
We analyzed five portfolios (100% long, 75% long, 50% long/short, 75% short, and 100% short) for the average annual return, volatility, and number of years with positive returns.
Here’s the results:
The best performing portfolio was 100% short, with an average annual return of 14.5%. The 75% short portfolio had nearly as good of returns at 13.1%, with the lowest volatility (using standard deviation) at +/- 17%.
Both the 100% short and 75% short portfolios provided positive returns in 7 of the last 9 years. Meanwhile, going long was much more risky. A 100% long portfolio had gains in only 4 of 9 years, with a huge standard deviation of +/- 55%.
Over the time period in question, energy commodities killed portfolios with “long” exposure. In 2011 and in 2015, the worst performer of the previous year (natural gas and oil respectively) was also the worst performer the following year, creating terrible returns for the long-heavy portfolios.
Oil, for example, was down -45.6% in 2014 and then was also down -30.5% in 2015. Not a very effective strategy.
What will be a better trade in 2016: shorting the best performing commodity of last year (lead), or going long on nickel, the worst performer of 2015?


Copper
Brass Rods: The Sustainable Choice
Brass rods can help cut emissions in machine shops, be recycled without losing properties, and contribute to a cleaner environment.


Brass Rods: The Sustainable Choice
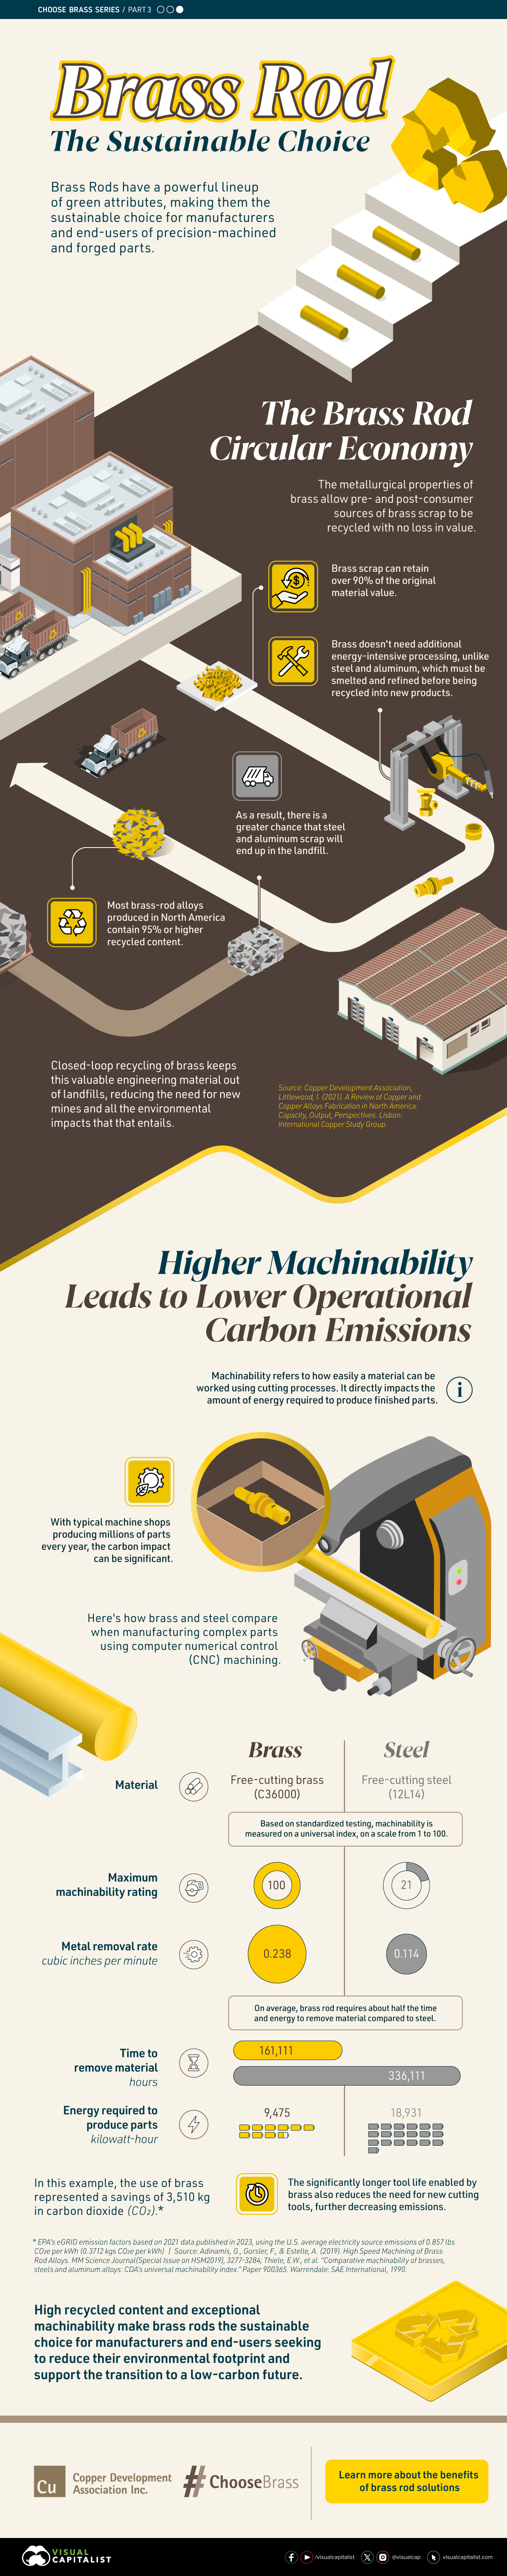
Brass rods have a powerful lineup of green attributes, making them the sustainable choice for manufacturers and end-users of precision machined and forged parts.
This infographic, from the Copper Development Association, shows how brass rods can reduce emissions in machine shops, be recycled without losing properties, and contribute to a cleaner environment.
The Brass Rod Circular Economy
The metallurgical properties of brass allow pre- and post-consumer sources of brass scrap to be recycled with no loss in properties.
Brass scrap can retain over 90% of the original material value. In addition, brass doesn’t need energy-intensive processing, unlike steel and aluminum, which must be smelted and refined before being recycled into new products.
As a result, there is a greater chance that steel and aluminum scrap will end up in landfills.
Most brass-rod alloys produced in North America contain 95% or higher recycled content.
Closed-loop recycling of brass keeps this valuable engineering material out of landfills, reducing the need for new mines and all the environmental impacts that entails.
Higher Machinability Leads to Lower Operational Carbon Emissions
Machinability is how easily a material can be worked using cutting processes. It directly impacts the amount of energy required to produce finished parts.
With typical machine shops producing millions of parts each year, the carbon impact can be significant.
Here’s how brass and steel compare when manufacturing complex parts using computer numerical control (CNC) machining.
| Material | Brass | Steel |
|---|---|---|
| Type | Free-cutting brass (C36000) | Free-cutting steel (12L14) |
| Maximum machinability rating (0-100) | 100 | 21 |
| Metal Removal Rate (cubic inches per minute) | 0.238 | 0.114 |
| Time to remove material (hours) | 161,111 | 336,111 |
| Energy required to produce parts (kilowatt-hours) | 9,475 | 18,931 |
In this example, using brass represented a savings of 3,510 kg in carbon dioxide (CO2).
The significantly longer tool life enabled by brass also reduces the need for new cutting tools, further decreasing emissions.
High recycled content and exceptional machinability make brass rods the sustainable choice for manufacturers and end-users seeking to reduce their environmental footprint and support the transition to a low-carbon future.
Explore the advantages of brass rod solutions.

-

 Base Metals1 year ago
Ranked: The World’s Largest Copper Producers
Many new technologies critical to the energy transition rely on copper. Here are the world’s largest copper producers.
-

 Silver2 years ago
Mapped: Solar Power by Country in 2021
In 2020, solar power saw its largest-ever annual capacity expansion at 127 gigawatts. Here’s a snapshot of solar power capacity by country.
-

 Batteries5 years ago
Visualizing Copper’s Role in the Transition to Clean Energy
A clean energy transition is underway as wind, solar, and batteries take center stage. Here’s how copper plays the critical role in these technologies.
-

 Science5 years ago
Everything You Need to Know on VMS Deposits
Deep below the ocean’s waves, VMS deposits spew out massive amounts of minerals like copper, zinc, and gold, making them a key source of the metals…
-
 Copper5 years ago
How Much Copper is in an Electric Vehicle?
Have you ever wondered how much copper is in an electric vehicle? This infographic shows the metal’s properties as well as the quantity of copper used.
-
 Copper6 years ago
Copper: Driving the Green Energy Revolution
Renewable energy is set to fuel a new era of copper demand – here’s how much copper is used in green applications from EVs to photovoltaics.


-

 Demographics1 week ago
The Countries That Have Become Sadder Since 2010
-

 Green2 weeks ago
Ranked: The Countries With the Most Air Pollution in 2023
-

 Green2 weeks ago
Ranking the Top 15 Countries by Carbon Tax Revenue
-

 Markets2 weeks ago
U.S. Debt Interest Payments Reach $1 Trillion
-

 Mining2 weeks ago
Gold vs. S&P 500: Which Has Grown More Over Five Years?
-

 Energy2 weeks ago
The World’s Biggest Nuclear Energy Producers
-

 Misc2 weeks ago
How Hard Is It to Get Into an Ivy League School?
-

 Debt2 weeks ago
How Debt-to-GDP Ratios Have Changed Since 2000