Markets
China’s Economy: The Sum of the Parts
China’s Economy: The Sum of the Parts
Click here to view the infographic at full size.
Geographically vast countries such as the United States or Canada have incredible diversity within their borders. Every part of the country appears unique, as the distribution of population, culture, geographical features, natural resources, and regional industries vary from place to place.
Think of the differences within the U.S. alone: Silicon Valley is known for its technology and dry weather, while New York City is diverse and busy financial hub. Detroit and the other cities situated in the Great Lake States are all known for manufacturing. Meanwhile, Alaska is a center for natural resources, providing the rest of the country with much of its energy, fishing, and metal resources.
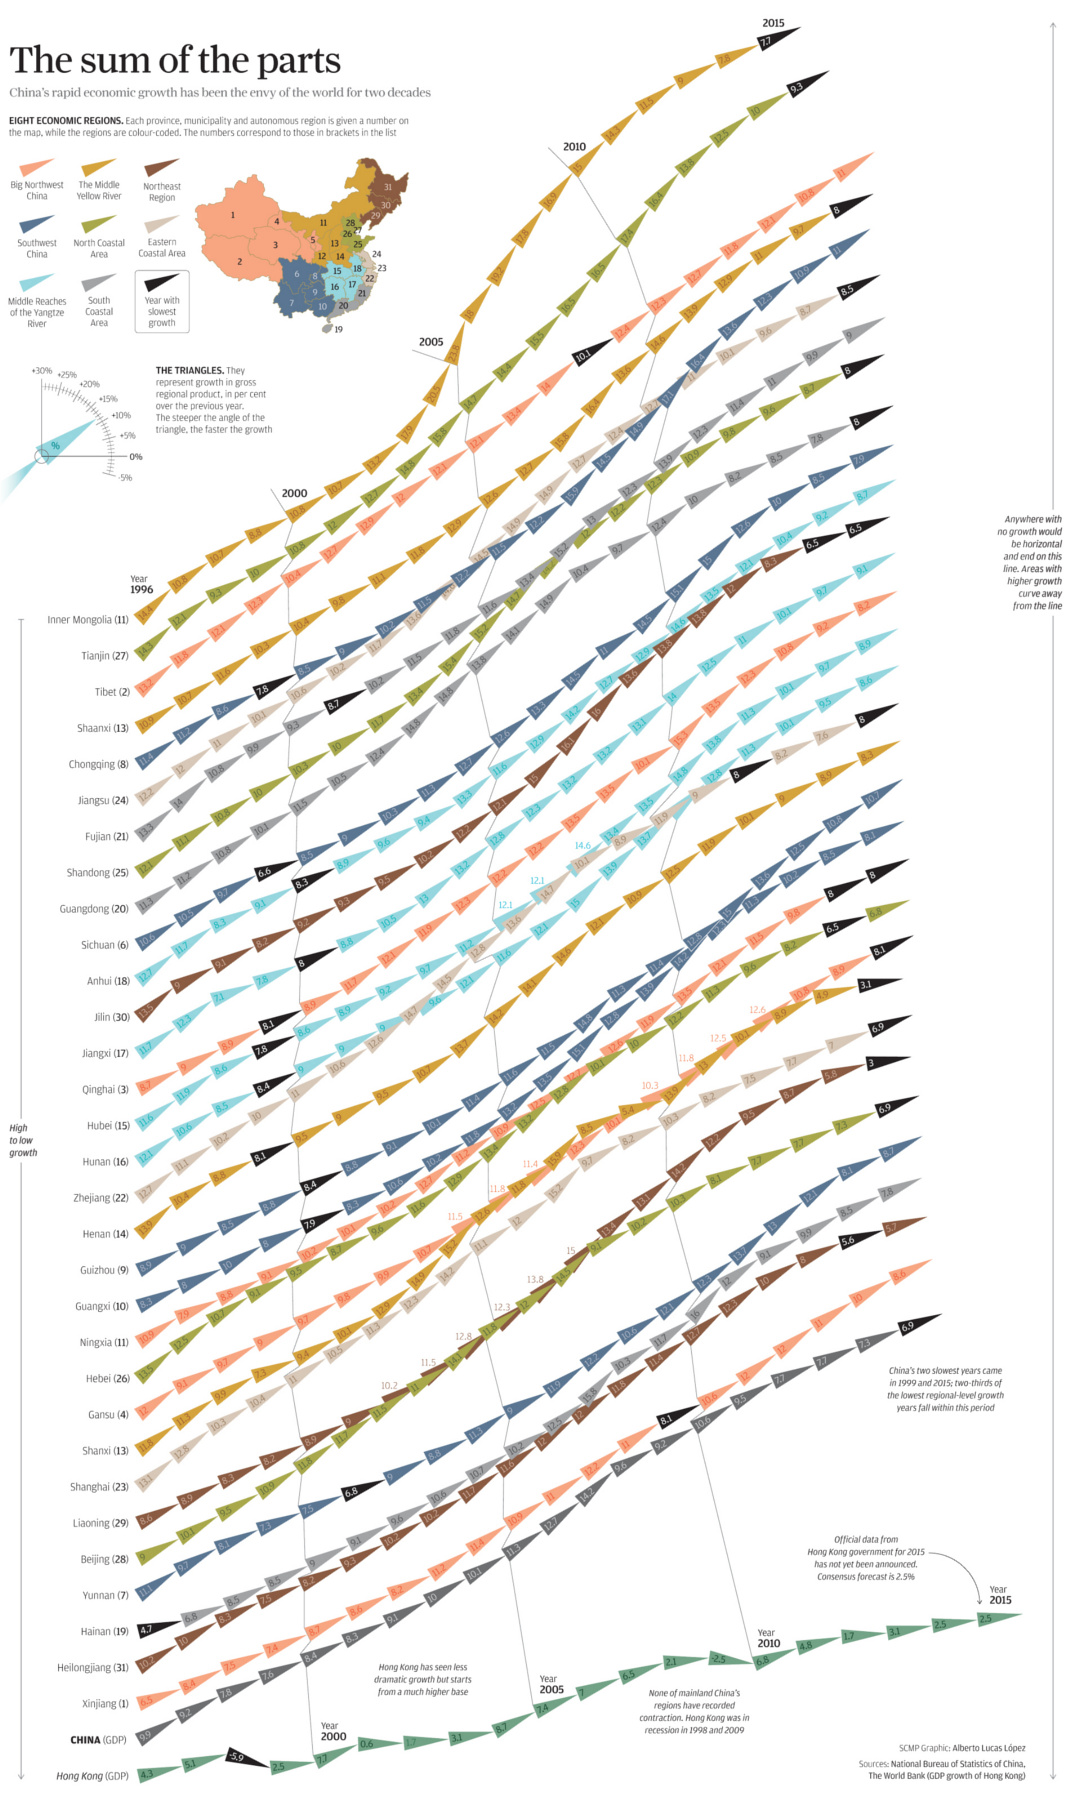
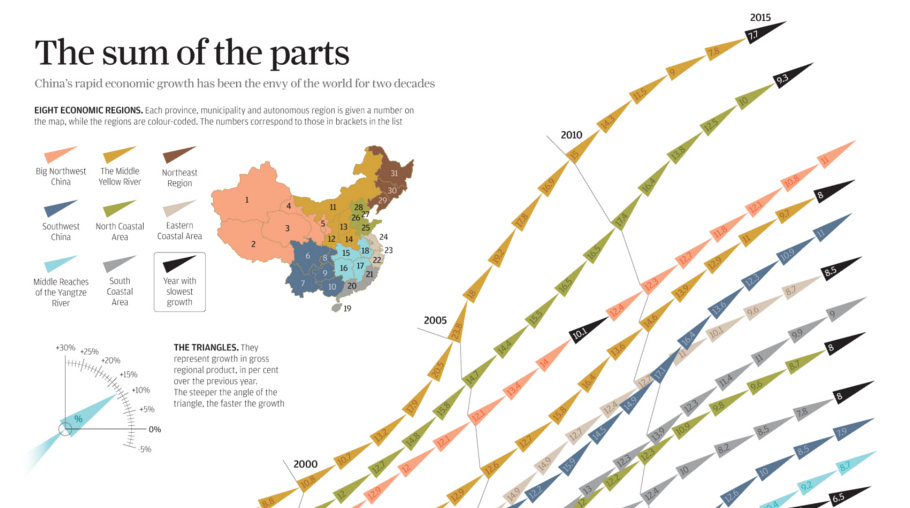
China is not much different in this regard, and today’s infographic shows the growth of individual provinces, municipalities, and other administrative areas within the country over the last 20 years.
Specific Growth Stories in China
There are several growth stories that stand out.
While many contain similar themes, each is very unique in its own right and worth studying further. Here are just some of the rapidly growing places in China that caught our eye:
Inner Mongolia
Inner Mongolia, the region of China that borders the country of Mongolia on both the south and east, is extremely rich in natural resources. Making up 12% of the country’s land mass, the region holds 25% of the world’s coal reserves and also produces rare earths, natural gas, and other commodities. Inner Mongolia has the highest installed wind power capacity in China, and the region is also the country’s largest livestock producer.
Inner Mongolia’s economy averaged just under 20% growth per year in the years from 2005-2010.
Tianjin
Tianjin is the primary industrial, commercial and economic center of North China with 15.2 million people. It’s a hub for high-tech manufacturing and logistics, producing many of the cell phone parts used throughout the world. Manufacturing makes up 47.4% of the municipality’s industrial sector, and Tianjin is one of China’s largest port cities.
Tianjin’s economy continued to accelerate from 2000 (10.8% growth) all the way to 2012 (16.4% growth) before starting to decline. The city is still growing faster than the rest of China, registering 9.3% growth in 2015.
Tibet
Tibet, known mainly as a center of Buddhism and the home of the currently exiled Dalai Lama, is a rapidly changing place. Despite a rich pastoral and nomadic tradition, Tibet is becoming more urban and diversified in terms of industry.
Tibet’s GDP, which was only 327 million yuan in 1965, has soared to 92.08 billion yuan ($14.5 billion) in 2014. This is a 281-fold increase.
Chongqing
In 2014, heavy industry made up 74% of Chongqing’s gross industrial output. The sprawling megacity and surrounding area has 32 million people, and sits at the end of the mighty Yangtze River. Chongqing produces much of the country’s automobiles, military equipment, steel, and aluminum.
Despite the national economy slowing to a 25-year low of 6.9% growth in 2015, Chongqing racked up 11% growth in the year.
Original graphic by: SCMP


Markets
The European Stock Market: Attractive Valuations Offer Opportunities
On average, the European stock market has valuations that are nearly 50% lower than U.S. valuations. But how can you access the market?


European Stock Market: Attractive Valuations Offer Opportunities
Europe is known for some established brands, from L’Oréal to Louis Vuitton. However, the European stock market offers additional opportunities that may be lesser known.
The above infographic, sponsored by STOXX, outlines why investors may want to consider European stocks.
Attractive Valuations
Compared to most North American and Asian markets, European stocks offer lower or comparable valuations.
| Index | Price-to-Earnings Ratio | Price-to-Book Ratio |
|---|---|---|
| EURO STOXX 50 | 14.9 | 2.2 |
| STOXX Europe 600 | 14.4 | 2 |
| U.S. | 25.9 | 4.7 |
| Canada | 16.1 | 1.8 |
| Japan | 15.4 | 1.6 |
| Asia Pacific ex. China | 17.1 | 1.8 |
Data as of February 29, 2024. See graphic for full index names. Ratios based on trailing 12 month financials. The price to earnings ratio excludes companies with negative earnings.
On average, European valuations are nearly 50% lower than U.S. valuations, potentially offering an affordable entry point for investors.
Research also shows that lower price ratios have historically led to higher long-term returns.
Market Movements Not Closely Connected
Over the last decade, the European stock market had low-to-moderate correlation with North American and Asian equities.
The below chart shows correlations from February 2014 to February 2024. A value closer to zero indicates low correlation, while a value of one would indicate that two regions are moving in perfect unison.
| EURO STOXX 50 | STOXX EUROPE 600 | U.S. | Canada | Japan | Asia Pacific ex. China |
|
|---|---|---|---|---|---|---|
| EURO STOXX 50 | 1.00 | 0.97 | 0.55 | 0.67 | 0.24 | 0.43 |
| STOXX EUROPE 600 | 1.00 | 0.56 | 0.71 | 0.28 | 0.48 | |
| U.S. | 1.00 | 0.73 | 0.12 | 0.25 | ||
| Canada | 1.00 | 0.22 | 0.40 | |||
| Japan | 1.00 | 0.88 | ||||
| Asia Pacific ex. China | 1.00 |
Data is based on daily USD returns.
European equities had relatively independent market movements from North American and Asian markets. One contributing factor could be the differing sector weights in each market. For instance, technology makes up a quarter of the U.S. market, but health care and industrials dominate the broader European market.
Ultimately, European equities can enhance portfolio diversification and have the potential to mitigate risk for investors.
Tracking the Market
For investors interested in European equities, STOXX offers a variety of flagship indices:
| Index | Description | Market Cap |
|---|---|---|
| STOXX Europe 600 | Pan-regional, broad market | €10.5T |
| STOXX Developed Europe | Pan-regional, broad-market | €9.9T |
| STOXX Europe 600 ESG-X | Pan-regional, broad market, sustainability focus | €9.7T |
| STOXX Europe 50 | Pan-regional, blue-chip | €5.1T |
| EURO STOXX 50 | Eurozone, blue-chip | €3.5T |
Data is as of February 29, 2024. Market cap is free float, which represents the shares that are readily available for public trading on stock exchanges.
The EURO STOXX 50 tracks the Eurozone’s biggest and most traded companies. It also underlies one of the world’s largest ranges of ETFs and mutual funds. As of November 2023, there were €27.3 billion in ETFs and €23.5B in mutual fund assets under management tracking the index.
“For the past 25 years, the EURO STOXX 50 has served as an accurate, reliable and tradable representation of the Eurozone equity market.”
— Axel Lomholt, General Manager at STOXX
Partnering with STOXX to Track the European Stock Market
Are you interested in European equities? STOXX can be a valuable partner:
- Comprehensive, liquid and investable ecosystem
- European heritage, global reach
- Highly sophisticated customization capabilities
- Open architecture approach to using data
- Close partnerships with clients
- Part of ISS STOXX and Deutsche Börse Group
With a full suite of indices, STOXX can help you benchmark against the European stock market.
Learn how STOXX’s European indices offer liquid and effective market access.

-

 Economy4 days ago
Economic Growth Forecasts for G7 and BRICS Countries in 2024
The IMF has released its economic growth forecasts for 2024. How do the G7 and BRICS countries compare?
-

 Markets2 weeks ago
U.S. Debt Interest Payments Reach $1 Trillion
U.S. debt interest payments have surged past the $1 trillion dollar mark, amid high interest rates and an ever-expanding debt burden.
-

 United States2 weeks ago
Ranked: The Largest U.S. Corporations by Number of Employees
We visualized the top U.S. companies by employees, revealing the massive scale of retailers like Walmart, Target, and Home Depot.
-

 Markets2 weeks ago
The Top 10 States by Real GDP Growth in 2023
This graphic shows the states with the highest real GDP growth rate in 2023, largely propelled by the oil and gas boom.
-

 Markets3 weeks ago
Ranked: The World’s Top Flight Routes, by Revenue
In this graphic, we show the highest earning flight routes globally as air travel continued to rebound in 2023.
-

 Markets3 weeks ago
Ranked: The Most Valuable Housing Markets in America
The U.S. residential real estate market is worth a staggering $47.5 trillion. Here are the most valuable housing markets in the country.


-

 Science1 week ago
Visualizing the Average Lifespans of Mammals
-

 Demographics2 weeks ago
The Smallest Gender Wage Gaps in OECD Countries
-

 United States2 weeks ago
Where U.S. Inflation Hit the Hardest in March 2024
-

 Green2 weeks ago
Top Countries By Forest Growth Since 2001
-
United States2 weeks ago
Ranked: The Largest U.S. Corporations by Number of Employees
-

 Maps2 weeks ago
The Largest Earthquakes in the New York Area (1970-2024)
-

 Green2 weeks ago
Ranked: The Countries With the Most Air Pollution in 2023
-

 Green2 weeks ago
Ranking the Top 15 Countries by Carbon Tax Revenue