Technology
The Fastest Startups to Hit $1 Billion Valuations
For the founders coding in the trenches of Silicon Valley, achieving the status of a “unicorn” is still the Holy Grail. The term, which references the presumably rare and mythological uni-horned creature, is used to describe a tech startup that has hit a $1 billion valuation or more.
At the time the term was coined, unicorns were indeed rare. Aileen Lee’s data from 2003-2013 showed that just four unicorns were born a year, and that only 39 existed as of November 2013. However, while actual unicorns continue to be (very) difficult to find, the ones of the tech variety have been proliferating like bunnies.
By the count of VentureBeat, there are now 229 of them with a cumulative $1.3 trillion valuation.
The Unicorn Baby Boom
Fleximize recently created an interactive visualization that breaks down the fastest startups to reach a $1 billion valuation by geography, sector, year, and also the timeframe needed to reach the mark. We’ve pulled out the key visuals in this post, but we highly recommend viewing their interactive list which provides data on each company as well.
We’ll show the whole list of unicorns later in this article, but for now we will focus on the high level stuff: how many more unicorns are being born? Are startups achieving unicorn status faster than before?
Unicorn Births Per Year
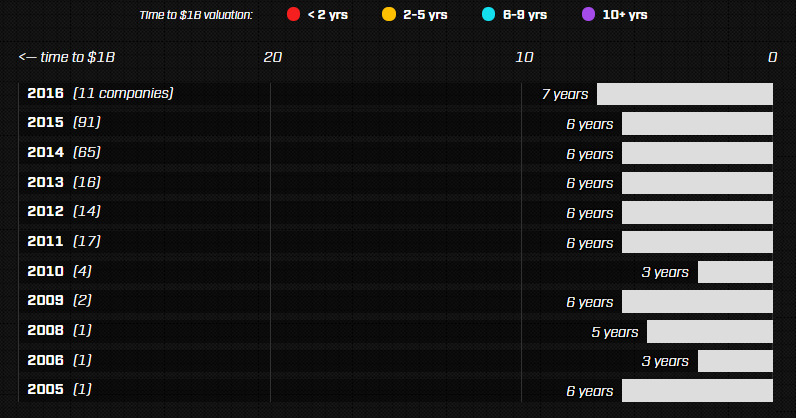
The above chart shows unicorn births each year from 2005 until today. There’s two important things to consider here:
Time to Achieve Unicorn Status: Despite the current froth in the venture capital market, it appears that the amount of time it takes to become a unicorn has remained relatively consistent. The average is around six years to go from the founding of the company to a $1 billion+ valuation.
More Unicorn Births: While it takes the same amount of time to become a unicorn, tech culture has become much more mainstream. Today, millions of startups are launched each year and 90% of them fail. However, the ones that get past the gauntlet raise billions of dollars from VCs.
According to the above chart, there were 65 new unicorns in 2014, and an additional 91 in 2015.
Unicorns by Birthplace
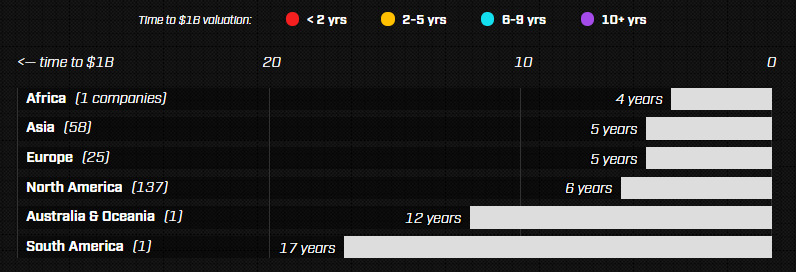
The majority of unicorns are still born in North America, which holds 61.4% of the population. However, Asia is rising fast with 58 unicorns (26.0%). It’s also worth noting that Asian unicorns spend a little less time in the womb, taking five years to be born. This is comparatively lower to the international average of six years.
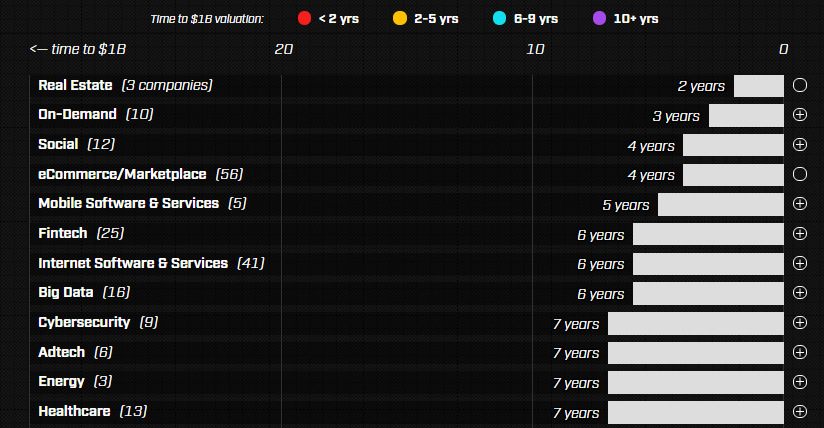
Unicorns by Profession
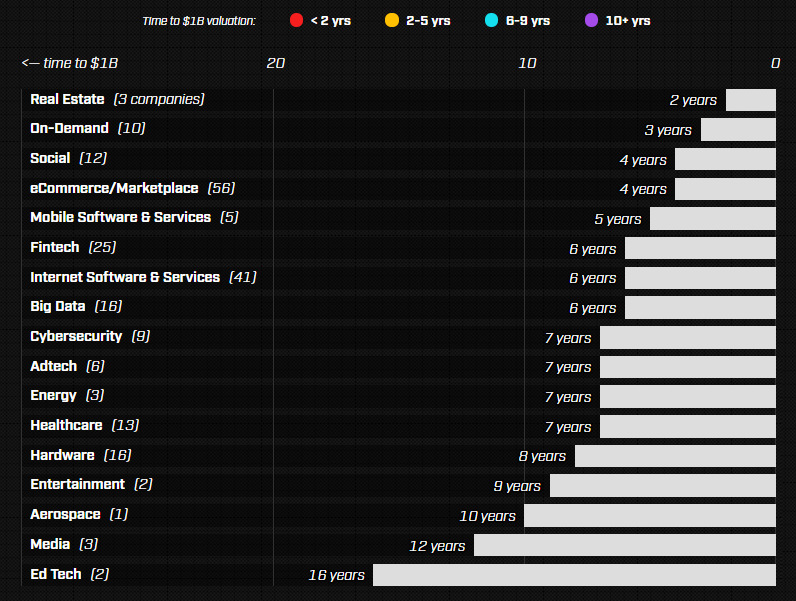
The unicorns that are born the fastest are ones focused on industries such as real estate, on-demand, social media, or e-commerce. These took four or less years on average.
Education tech and media companies took a long time to reach unicorn status – 16 years and 12 years respectively. That said, the dataset is quite small with only five companies in these categories combined.
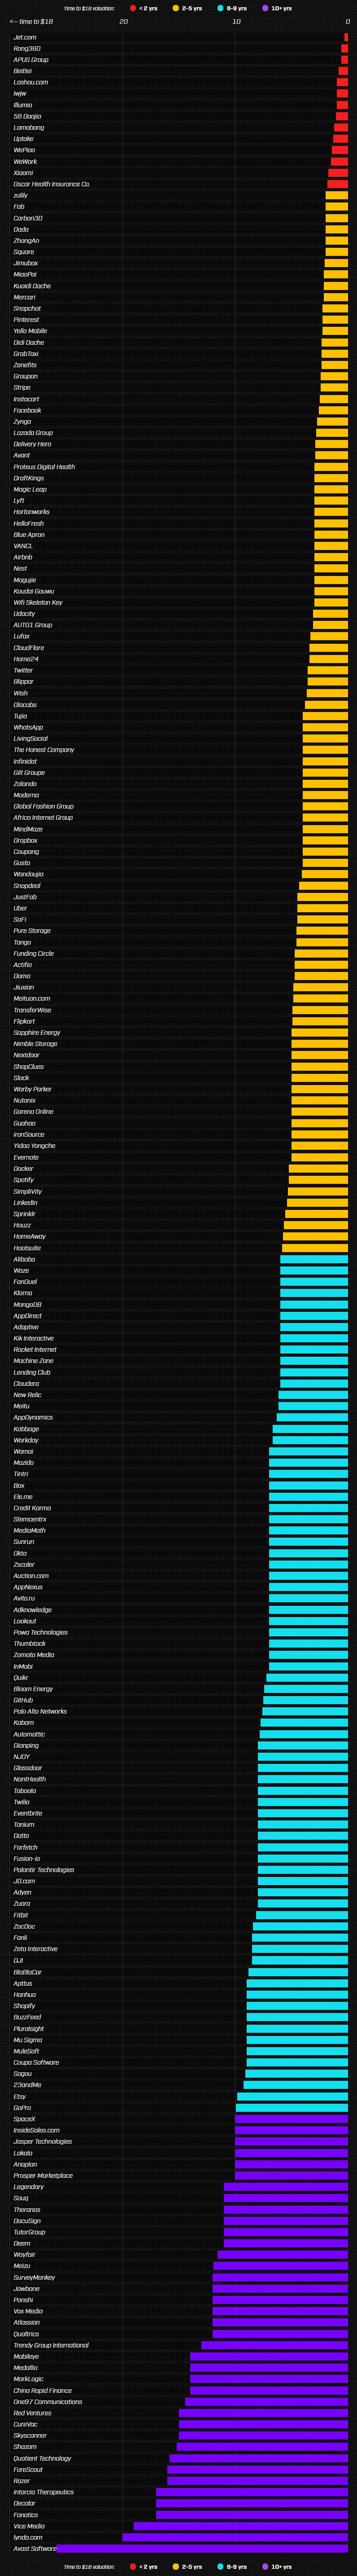
The Fastest Startups (The Whole List)
Below is the full list of companies valued at $1 billion or more.
The absolute fastest startup?
It’s Jet.com, an online retailer said to possibly rival Amazon, that uses real-time pricing algorithms to give consumers better deals. It hit a $1 billion valuation in just four months in 2015.


Brands
How Tech Logos Have Evolved Over Time
From complete overhauls to more subtle tweaks, these tech logos have had quite a journey. Featuring: Google, Apple, and more.


How Tech Logos Have Evolved Over Time
This was originally posted on our Voronoi app. Download the app for free on iOS or Android and discover incredible data-driven charts from a variety of trusted sources.
One would be hard-pressed to find a company that has never changed its logo. Granted, some brands—like Rolex, IBM, and Coca-Cola—tend to just have more minimalistic updates. But other companies undergo an entire identity change, thus necessitating a full overhaul.
In this graphic, we visualized the evolution of prominent tech companies’ logos over time. All of these brands ranked highly in a Q1 2024 YouGov study of America’s most famous tech brands. The logo changes are sourced from 1000logos.net.
How Many Times Has Google Changed Its Logo?
Google and Facebook share a 98% fame rating according to YouGov. But while Facebook’s rise was captured in The Social Network (2010), Google’s history tends to be a little less lionized in popular culture.
For example, Google was initially called “Backrub” because it analyzed “back links” to understand how important a website was. Since its founding, Google has undergone eight logo changes, finally settling on its current one in 2015.
| Company | Number of Logo Changes |
|---|---|
| 8 | |
| HP | 8 |
| Amazon | 6 |
| Microsoft | 6 |
| Samsung | 6 |
| Apple | 5* |
Note: *Includes color changes. Source: 1000Logos.net
Another fun origin story is Microsoft, which started off as Traf-O-Data, a traffic counter reading company that generated reports for traffic engineers. By 1975, the company was renamed. But it wasn’t until 2012 that Microsoft put the iconic Windows logo—still the most popular desktop operating system—alongside its name.
And then there’s Samsung, which started as a grocery trading store in 1938. Its pivot to electronics started in the 1970s with black and white television sets. For 55 years, the company kept some form of stars from its first logo, until 1993, when the iconic encircled blue Samsung logo debuted.
Finally, Apple’s first logo in 1976 featured Isaac Newton reading under a tree—moments before an apple fell on his head. Two years later, the iconic bitten apple logo would be designed at Steve Jobs’ behest, and it would take another two decades for it to go monochrome.

-

 Travel1 week ago
Airline Incidents: How Do Boeing and Airbus Compare?
-

 Markets3 weeks ago
Visualizing America’s Shortage of Affordable Homes
-

 Green2 weeks ago
Ranked: Top Countries by Total Forest Loss Since 2001
-

 Money2 weeks ago
Where Does One U.S. Tax Dollar Go?
-

 Misc2 weeks ago
Almost Every EV Stock is Down After Q1 2024
-

 AI2 weeks ago
The Stock Performance of U.S. Chipmakers So Far in 2024
-

 Markets2 weeks ago
Charted: Big Four Market Share by S&P 500 Audits
-

 Real Estate2 weeks ago
Ranked: The Most Valuable Housing Markets in America