Markets
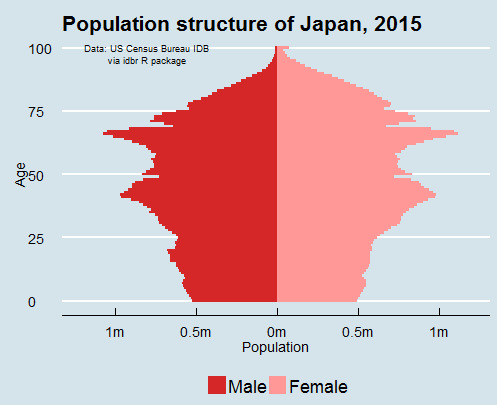
Animation: Japan’s Aging Population
Japan’s infamous “Lost Decade” was supposed to refer to the stagnant economic period from 1991 until 2000, after the collapse of the asset price bubble in Japanese housing and stocks.
However, it seems the phrase was coined a little early, as now it seems even more ominous. The “Lost Decade” has turned into the “Lost Two Decades”, and many of the same economic problems continue to plague the nation today.
The most recent data from Japan’s Cabinet Office pegged Japan’s GDP growth in Q4 of 2015 at -0.3% compared with the previous three months.
That’s now two negative quarters out of the four in 2015.
Japan’s Demographic Headwinds
The problem is that the outlook isn’t getting any better with time.
Japan is saddled with the most debt of any country, the largest monetary base as a percentage of GDP in the developed world, and the BoJ has now endeavored to go negative with interest rates.
In the background, and even more important, is Japan’s lingering demographic crisis. The country’s population is projected to fall from 127 million to 87 million by 2060, at which point more than 40% of the population will be older than 65.
Over the years, there have been many warnings that Japan’s population could begin to contract. However, this problem is now officially here, with the most recent census data showing that the Japanese population shrunk by nearly 1 million people between 2010 and 2015.
The working-age population could decline as much as 40% over the next 45 years. This would be coupled with a surge in the people dependent on social services, since Japan has some of the best life expectancy rates in the world.
By 2050, there could be just under 1 million Japanese that are 100 years and older in age.
Stopping the Decline
The urgency of Japan’s aging population is not lost on the public. In a recent Pew poll, Japanese respondents were asked if the next generation of children would be better or worse off than their parents. The overwhelming victor was “worse off” with a 72% share of the vote.
That’s why the current stated goal of the government is to keep the nation’s population from falling below 100 million by 2060. To do this, Japan is now working on “bold proposals” to find ways to raise the birthrate. The traditionally isolationist Japanese culture is even warming towards the idea of getting new blood through immigration.
However, even in meeting this audacious goal, the country’s population will still decline by 27 million people by 2060. It’s also unclear if or when economic growth could turn around, even in the best case scenario.
Turning Japanese
Japan was the first country to experience the cruel cocktail of economic stagnation, shrinking population, spiraling debt, and desperate monetary policy.
However, it won’t be the last.
Germany has an eerily similar demographic cliff. The U.S. has racked up $8.4 trillion in new debt under the Obama administration.
Central banks around the world continue to take unprecedented action. QE, negative rates, the war on cash, and helicopter money are all coming to a country near you. No policy option is sacred anymore.
We must watch the Japanese problem closely, because we will need to have better solutions.
Original graphic by: Revolutions


Markets
The European Stock Market: Attractive Valuations Offer Opportunities
On average, the European stock market has valuations that are nearly 50% lower than U.S. valuations. But how can you access the market?


European Stock Market: Attractive Valuations Offer Opportunities
Europe is known for some established brands, from L’Oréal to Louis Vuitton. However, the European stock market offers additional opportunities that may be lesser known.
The above infographic, sponsored by STOXX, outlines why investors may want to consider European stocks.
Attractive Valuations
Compared to most North American and Asian markets, European stocks offer lower or comparable valuations.
| Index | Price-to-Earnings Ratio | Price-to-Book Ratio |
|---|---|---|
| EURO STOXX 50 | 14.9 | 2.2 |
| STOXX Europe 600 | 14.4 | 2 |
| U.S. | 25.9 | 4.7 |
| Canada | 16.1 | 1.8 |
| Japan | 15.4 | 1.6 |
| Asia Pacific ex. China | 17.1 | 1.8 |
Data as of February 29, 2024. See graphic for full index names. Ratios based on trailing 12 month financials. The price to earnings ratio excludes companies with negative earnings.
On average, European valuations are nearly 50% lower than U.S. valuations, potentially offering an affordable entry point for investors.
Research also shows that lower price ratios have historically led to higher long-term returns.
Market Movements Not Closely Connected
Over the last decade, the European stock market had low-to-moderate correlation with North American and Asian equities.
The below chart shows correlations from February 2014 to February 2024. A value closer to zero indicates low correlation, while a value of one would indicate that two regions are moving in perfect unison.
| EURO STOXX 50 | STOXX EUROPE 600 | U.S. | Canada | Japan | Asia Pacific ex. China |
|
|---|---|---|---|---|---|---|
| EURO STOXX 50 | 1.00 | 0.97 | 0.55 | 0.67 | 0.24 | 0.43 |
| STOXX EUROPE 600 | 1.00 | 0.56 | 0.71 | 0.28 | 0.48 | |
| U.S. | 1.00 | 0.73 | 0.12 | 0.25 | ||
| Canada | 1.00 | 0.22 | 0.40 | |||
| Japan | 1.00 | 0.88 | ||||
| Asia Pacific ex. China | 1.00 |
Data is based on daily USD returns.
European equities had relatively independent market movements from North American and Asian markets. One contributing factor could be the differing sector weights in each market. For instance, technology makes up a quarter of the U.S. market, but health care and industrials dominate the broader European market.
Ultimately, European equities can enhance portfolio diversification and have the potential to mitigate risk for investors.
Tracking the Market
For investors interested in European equities, STOXX offers a variety of flagship indices:
| Index | Description | Market Cap |
|---|---|---|
| STOXX Europe 600 | Pan-regional, broad market | €10.5T |
| STOXX Developed Europe | Pan-regional, broad-market | €9.9T |
| STOXX Europe 600 ESG-X | Pan-regional, broad market, sustainability focus | €9.7T |
| STOXX Europe 50 | Pan-regional, blue-chip | €5.1T |
| EURO STOXX 50 | Eurozone, blue-chip | €3.5T |
Data is as of February 29, 2024. Market cap is free float, which represents the shares that are readily available for public trading on stock exchanges.
The EURO STOXX 50 tracks the Eurozone’s biggest and most traded companies. It also underlies one of the world’s largest ranges of ETFs and mutual funds. As of November 2023, there were €27.3 billion in ETFs and €23.5B in mutual fund assets under management tracking the index.
“For the past 25 years, the EURO STOXX 50 has served as an accurate, reliable and tradable representation of the Eurozone equity market.”
— Axel Lomholt, General Manager at STOXX
Partnering with STOXX to Track the European Stock Market
Are you interested in European equities? STOXX can be a valuable partner:
- Comprehensive, liquid and investable ecosystem
- European heritage, global reach
- Highly sophisticated customization capabilities
- Open architecture approach to using data
- Close partnerships with clients
- Part of ISS STOXX and Deutsche Börse Group
With a full suite of indices, STOXX can help you benchmark against the European stock market.
Learn how STOXX’s European indices offer liquid and effective market access.

-

 Economy1 day ago
Economic Growth Forecasts for G7 and BRICS Countries in 2024
The IMF has released its economic growth forecasts for 2024. How do the G7 and BRICS countries compare?
-

 Markets1 week ago
U.S. Debt Interest Payments Reach $1 Trillion
U.S. debt interest payments have surged past the $1 trillion dollar mark, amid high interest rates and an ever-expanding debt burden.
-

 United States1 week ago
Ranked: The Largest U.S. Corporations by Number of Employees
We visualized the top U.S. companies by employees, revealing the massive scale of retailers like Walmart, Target, and Home Depot.
-

 Markets2 weeks ago
The Top 10 States by Real GDP Growth in 2023
This graphic shows the states with the highest real GDP growth rate in 2023, largely propelled by the oil and gas boom.
-

 Markets2 weeks ago
Ranked: The World’s Top Flight Routes, by Revenue
In this graphic, we show the highest earning flight routes globally as air travel continued to rebound in 2023.
-

 Markets2 weeks ago
Ranked: The Most Valuable Housing Markets in America
The U.S. residential real estate market is worth a staggering $47.5 trillion. Here are the most valuable housing markets in the country.


-

 Mining1 week ago
Gold vs. S&P 500: Which Has Grown More Over Five Years?
-
Markets2 weeks ago
Ranked: The Most Valuable Housing Markets in America
-

 Money2 weeks ago
Which States Have the Highest Minimum Wage in America?
-

 AI2 weeks ago
Ranked: Semiconductor Companies by Industry Revenue Share
-
Markets2 weeks ago
Ranked: The World’s Top Flight Routes, by Revenue
-

 Demographics2 weeks ago
Population Projections: The World’s 6 Largest Countries in 2075
-
Markets2 weeks ago
The Top 10 States by Real GDP Growth in 2023
-

 Demographics2 weeks ago
The Smallest Gender Wage Gaps in OECD Countries