Economy
Which Country is the Cheapest for Starting a Business?
View the full-size infographic map
Which Country is the Cheapest for Starting A Business?
Starting a new business isn’t as simple as coming up with an idea.
In addition to the time investment needed to formulate and create a business, there’s often a hefty capital requirement. A new business usually requires paying different fees for licensing, permits, and approvals, and many governments also have minimum on-hand capital requirements.
And costs are relative. Though it might be more costly to start a business in some countries on paper, affordability also takes into account relative income.
These graphics from BusinessFinancing.co.uk use data from the World Bank’s Doing Business 2020 report to examine the startup cost for a small-to-medium-size LLC in the largest business cities across 190 countries.
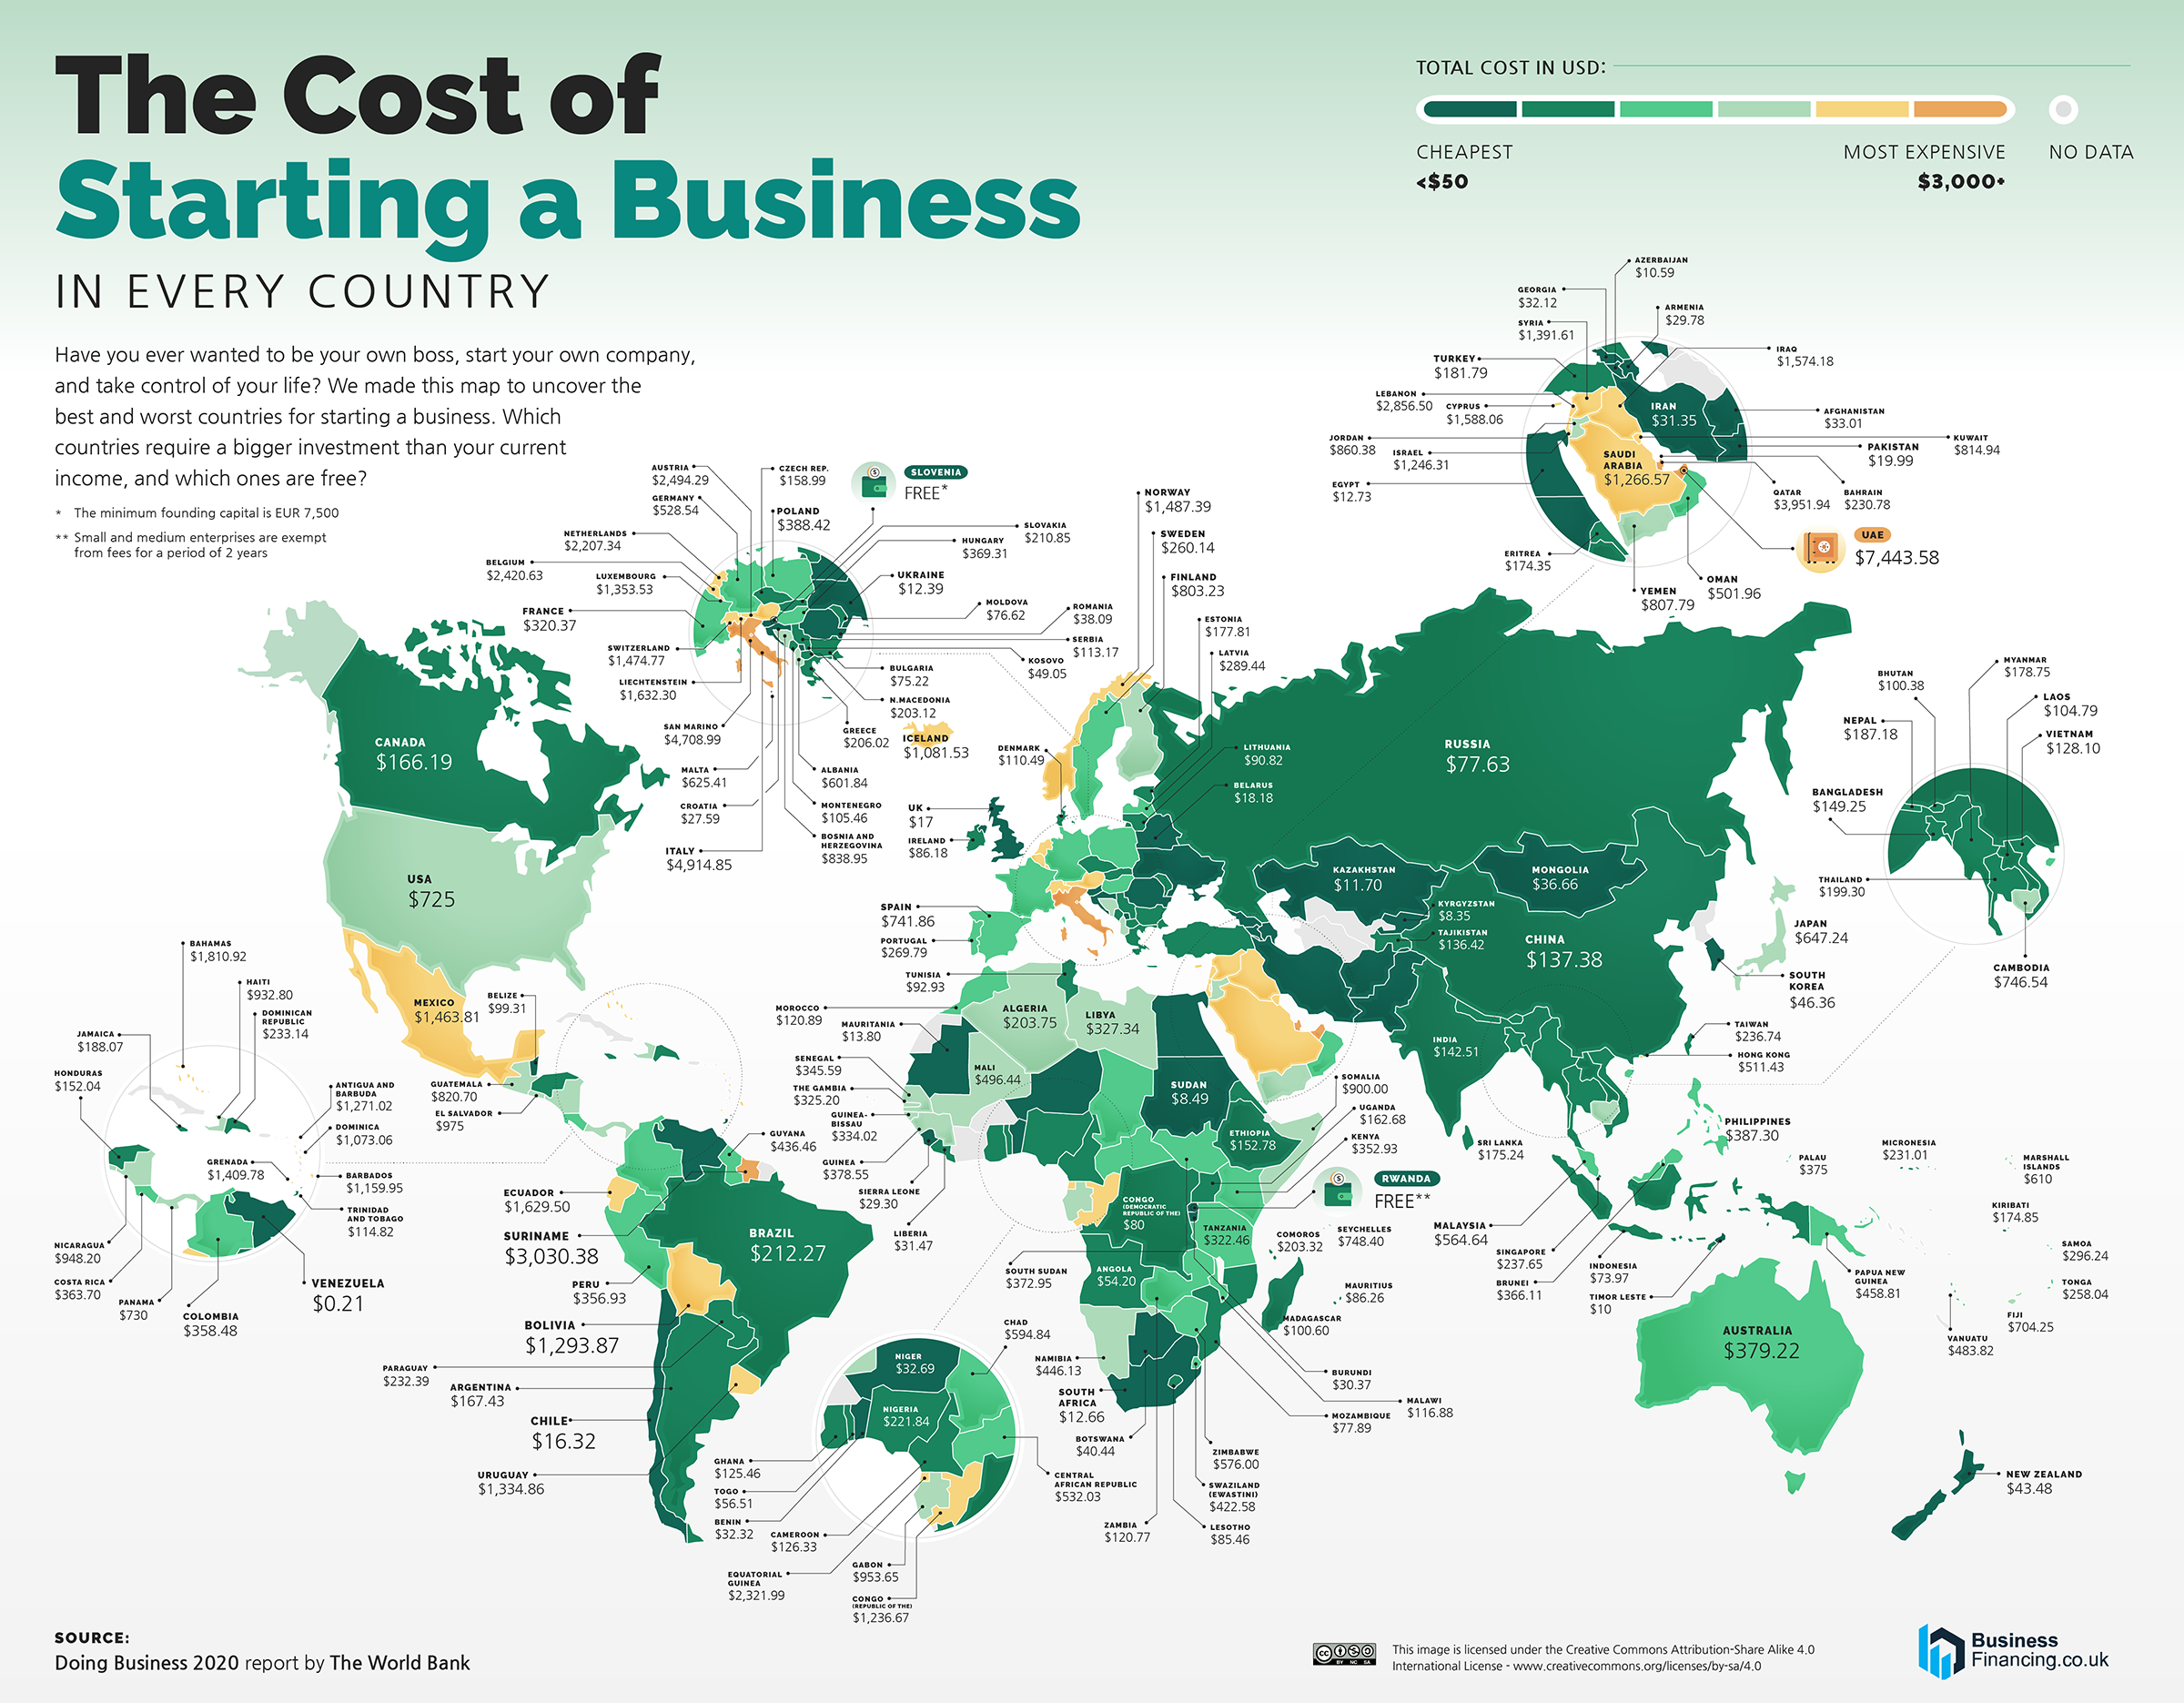
The Cost of Starting a Business in Different Countries
From a pure cost perspective, the affordability of starting a business is extremely dependent on where you are located.
Some countries make the cost of business extremely low to encourage more economic activity. Others have high or nearly inaccessible fees to protect existing businesses, or to simply cash in on the entrepreneurial spirit.
| Country | Cost (2020 USD) | % of Monthly Income |
|---|---|---|
| Venezuela | 0 | -% |
| Rwanda | 0 | -% |
| Slovenia | 0 | -% |
| Kyrgyzstan | 8 | 0.1 |
| Sudan | 8 | 0.13 |
| Timor Leste | 10 | 0.09 |
| Azerbaijan | 11 | 0.04 |
| Kazakhstan | 12 | 0.02 |
| Ukraine | 12 | 0.06 |
| Egypt | 13 | 0.07 |
| South Africa | 13 | 0.03 |
| Mauritania | 14 | 0.12 |
| Uzbekistan | 14 | 0.13 |
| Chile | 16 | 0.02 |
| United Kingdom | 17 | 0.01 |
| Belarus | 18 | 0.04 |
| Pakistan | 20 | 0.16 |
| Croatia | 27 | 0.03 |
| Sierra Leone | 29 | 0.81 |
| Armenia | 30 | 0.1 |
| Burundi | 30 | 1.77 |
| Iran | 31 | 0.09 |
| Benin | 32 | 0.38 |
| Liberia | 32 | 0.87 |
| Niger | 32 | 0.78 |
| Afghanistan | 33 | 0.86 |
| Georgia | 33 | 0.1 |
| Mongolia | 37 | 0.17 |
| Romania | 38 | 0.05 |
| Botswana | 40 | 0.08 |
| New Zealand | 43 | 0.02 |
| South Korea | 47 | 0.02 |
| Kosovo | 49 | -% |
| Angola | 54 | 0.63 |
| Togo | 56 | 1.29 |
| Indonesia | 74 | 0.3 |
| Bulgaria | 75 | 0.11 |
| Moldova | 76 | 0.24 |
| Mozambique | 76 | 2.09 |
| Russia | 77 | 0.11 |
| Congo (Democratic Republic of the) | 80 | 2.39 |
| Ireland | 86 | 0.02 |
| Lesotho | 86 | 0.89 |
| Mauritius | 86 | 0.1 |
| Lithuania | 90 | 0.07 |
| Tunisia | 93 | 0.42 |
| Belize | 99 | 0.33 |
| Bhutan | 100 | 0.45 |
| Madagascar | 100 | 2.72 |
| Laos | 105 | 0.68 |
| Montenegro | 105 | 0.16 |
| Denmark | 110 | 0.02 |
| Serbia | 112 | 0.24 |
| Trinidad and Tobago | 115 | 0.1 |
| Malawi | 117 | 4.72 |
| Morocco | 120 | 0.52 |
| Zambia | 120 | 1.28 |
| Cameroon | 125 | 1.24 |
| Ghana | 125 | 1.03 |
| Vietnam | 128 | 0.73 |
| Tajikistan | 136 | 1.86 |
| China | 138 | 0.21 |
| India | 142 | 0.98 |
| Bangladesh | 149 | 1.11 |
| Ethiopia | 150 | 3.21 |
| Honduras | 152 | 0.85 |
| Czech Republic | 158 | 0.13 |
| Uganda | 163 | 3.67 |
| Canada | 165 | 0.05 |
| Argentina | 167 | 0.21 |
| Eritrea | 174 | 4.63 |
| Kiribati | 174 | 0.7 |
| Estonia | 176 | 0.11 |
| Sri Lanka | 176 | 0.56 |
| Turkey | 177 | 0.28 |
| Myanmar | 179 | 1.73 |
| Nepal | 186 | 2.43 |
| Jamaica | 189 | 0.48 |
| Thailand | 201 | 0.43 |
| North Macedonia | 202 | 0.52 |
| Algeria | 203 | 0.79 |
| Comoros | 204 | 1.9 |
| Greece | 204 | 0.14 |
| Slovakia | 209 | 0.17 |
| Brazil | 218 | 0.35 |
| Nigeria | 223 | 1.68 |
| Bahrain | 231 | 0.14 |
| Micronesia, Federated States of | 231 | 0.82 |
| Paraguay | 232 | 0.61 |
| Dominican Republic | 233 | 0.39 |
| Singapore | 238 | 0.06 |
| Taiwan | 239 | -% |
| Sweden | 259 | 0.07 |
| Tonga | 262 | 0.78 |
| Portugal | 268 | 0.17 |
| Latvia | 287 | 0.25 |
| Samoa | 296 | 1 |
| France | 318 | 0.11 |
| Tanzania | 322 | 4.55 |
| The Gambia | 326 | 6.71 |
| Libya | 328 | 0.59 |
| Guinea-Bissau | 332 | 5.72 |
| Senegal | 343 | 3.35 |
| Kenya | 353 | 3.01 |
| Peru | 355 | 0.77 |
| Costa Rica | 363 | 0.4 |
| Colombia | 364 | 0.85 |
| Brunei | 366 | 0.18 |
| Hungary | 369 | 0.34 |
| South Sudan | 373 | 5.31 |
| Palau | 375 | -% |
| Australia | 377 | 0.1 |
| Guinea | 380 | 6.42 |
| Poland | 387 | 0.36 |
| Philippines | 389 | 1.44 |
| Swaziland (Eswatini) | 425 | 1.59 |
| Guyana | 436 | 1.29 |
| Namibia | 446 | 1.15 |
| Papua New Guinea | 459 | 2.71 |
| Vanuatu | 484 | 2.04 |
| Mali | 493 | 8.02 |
| Oman | 502 | 0.65 |
| Hong Kong | 512 | 1.2 |
| Germany | 524 | 0.16 |
| Central African Republic | 529 | 14.55 |
| Malaysia | 567 | 0.83 |
| Zimbabwe | 576 | 5.01 |
| Chad | 591 | 13.58 |
| Albania | 597 | 1.71 |
| Marshall Islands | 610 | -% |
| Malta | 620 | -% |
| Japan | 641 | 0.24 |
| Fiji | 705 | 1.65 |
| United States of America | 725 | 0.16 |
| Panama | 730 | 0.66 |
| Spain | 736 | 0.34 |
| Cambodia | 746 | 7.55 |
| Finland | 797 | 0.23 |
| Yemen | 808 | 10.7 |
| Kuwait | 814 | 0.31 |
| Guatemala | 819 | 2.63 |
| Bosnia and Herzegovina | 833 | 1.93 |
| Seychelles | 842 | 0.75 |
| Jordan | 860 | 2.67 |
| Somalia | 900 | -% |
| Haiti | 941 | 14.03 |
| Gabon | 947 | 2.18 |
| Nicaragua | 948 | 6.6 |
| El Salvador | 975 | 3.53 |
| Dominica | 1073 | 2.31 |
| Iceland | 1089 | 0.23 |
| Barbados | 1159 | 0.92 |
| Congo (Republic of the) | 1229 | 25.46 |
| Israel | 1241 | 0.41 |
| Saudi Arabia | 1267 | 0.81 |
| Antigua and Barbuda | 1271 | -% |
| Bolivia | 1293 | 5.67 |
| Luxembourg | 1343 | 0.27 |
| Uruguay | 1344 | 1.13 |
| Syria | 1392 | 10.41 |
| Grenada | 1410 | -% |
| Mexico | 1450 | 2.34 |
| Switzerland | 1463 | 0.27 |
| Norway | 1482 | 0.27 |
| Iraq | 1573 | 4.34 |
| Cyprus | 1576 | 0.72 |
| Liechtenstein | 1619 | -% |
| Ecuador | 1630 | 4.23 |
| Bahamas | 1810 | 0.89 |
| Netherlands | 2190 | 0.59 |
| Equatorial Guinea | 2322 | 7.18 |
| Belgium | 2402 | 0.74 |
| Austria | 2475 | 0.71 |
| Lebanon | 2855 | 5.35 |
| Suriname | 3030 | 11.14 |
| Qatar | 3952 | 0.92 |
| San Marino | 4672 | -% |
| Italy | 4876 | 2.02 |
| United Arab Emirates | 7444 | 2.23 |
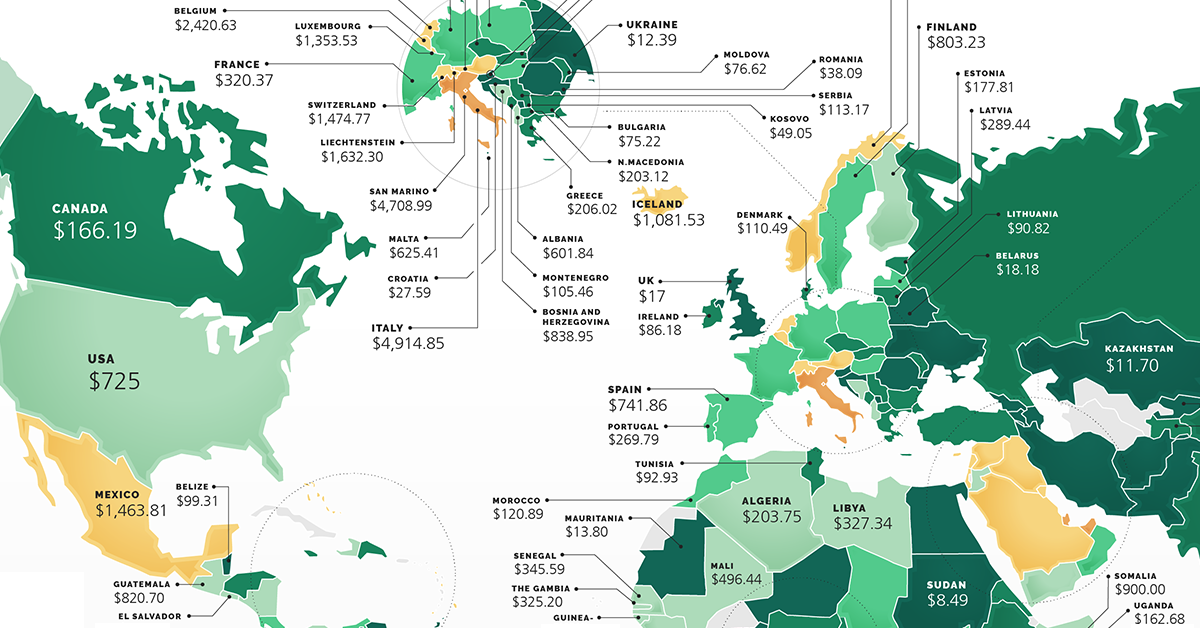
At a glance, the cheapest regions for starting a business include Central Asia and Africa.
But the cheapest countries on the dollar for a new startup are Venezuela, Rwanda, and Slovenia. While the former does have fees that only total $0.21, both Rwanda and Slovenia have no fees for new businesses, though Slovenia does have a capital requirement of €7,500.
Expensive countries for new businesses are also spread across the world. There are some in Europe, including Italy at $4,876 and Austria at $2,475, as well as the Americas, including Suriname at $3,030 and Ecuador at $1,630.
The most expensive countries, however, are largely in the Middle East. They include #1 UAE at $7,444, #4 Qatar at $3,952, and #6 Lebanon at $2,855.
Which Country is the Most Affordable for Starting a Business?
Just as costs vary by country, so too does relative affordability.
Though some countries are cheaper than others for starting a business on the dollar, the picture changes when accounting for monthly income. When it comes to the cost of starting a business relative to monthly income, many developed countries take the cake.
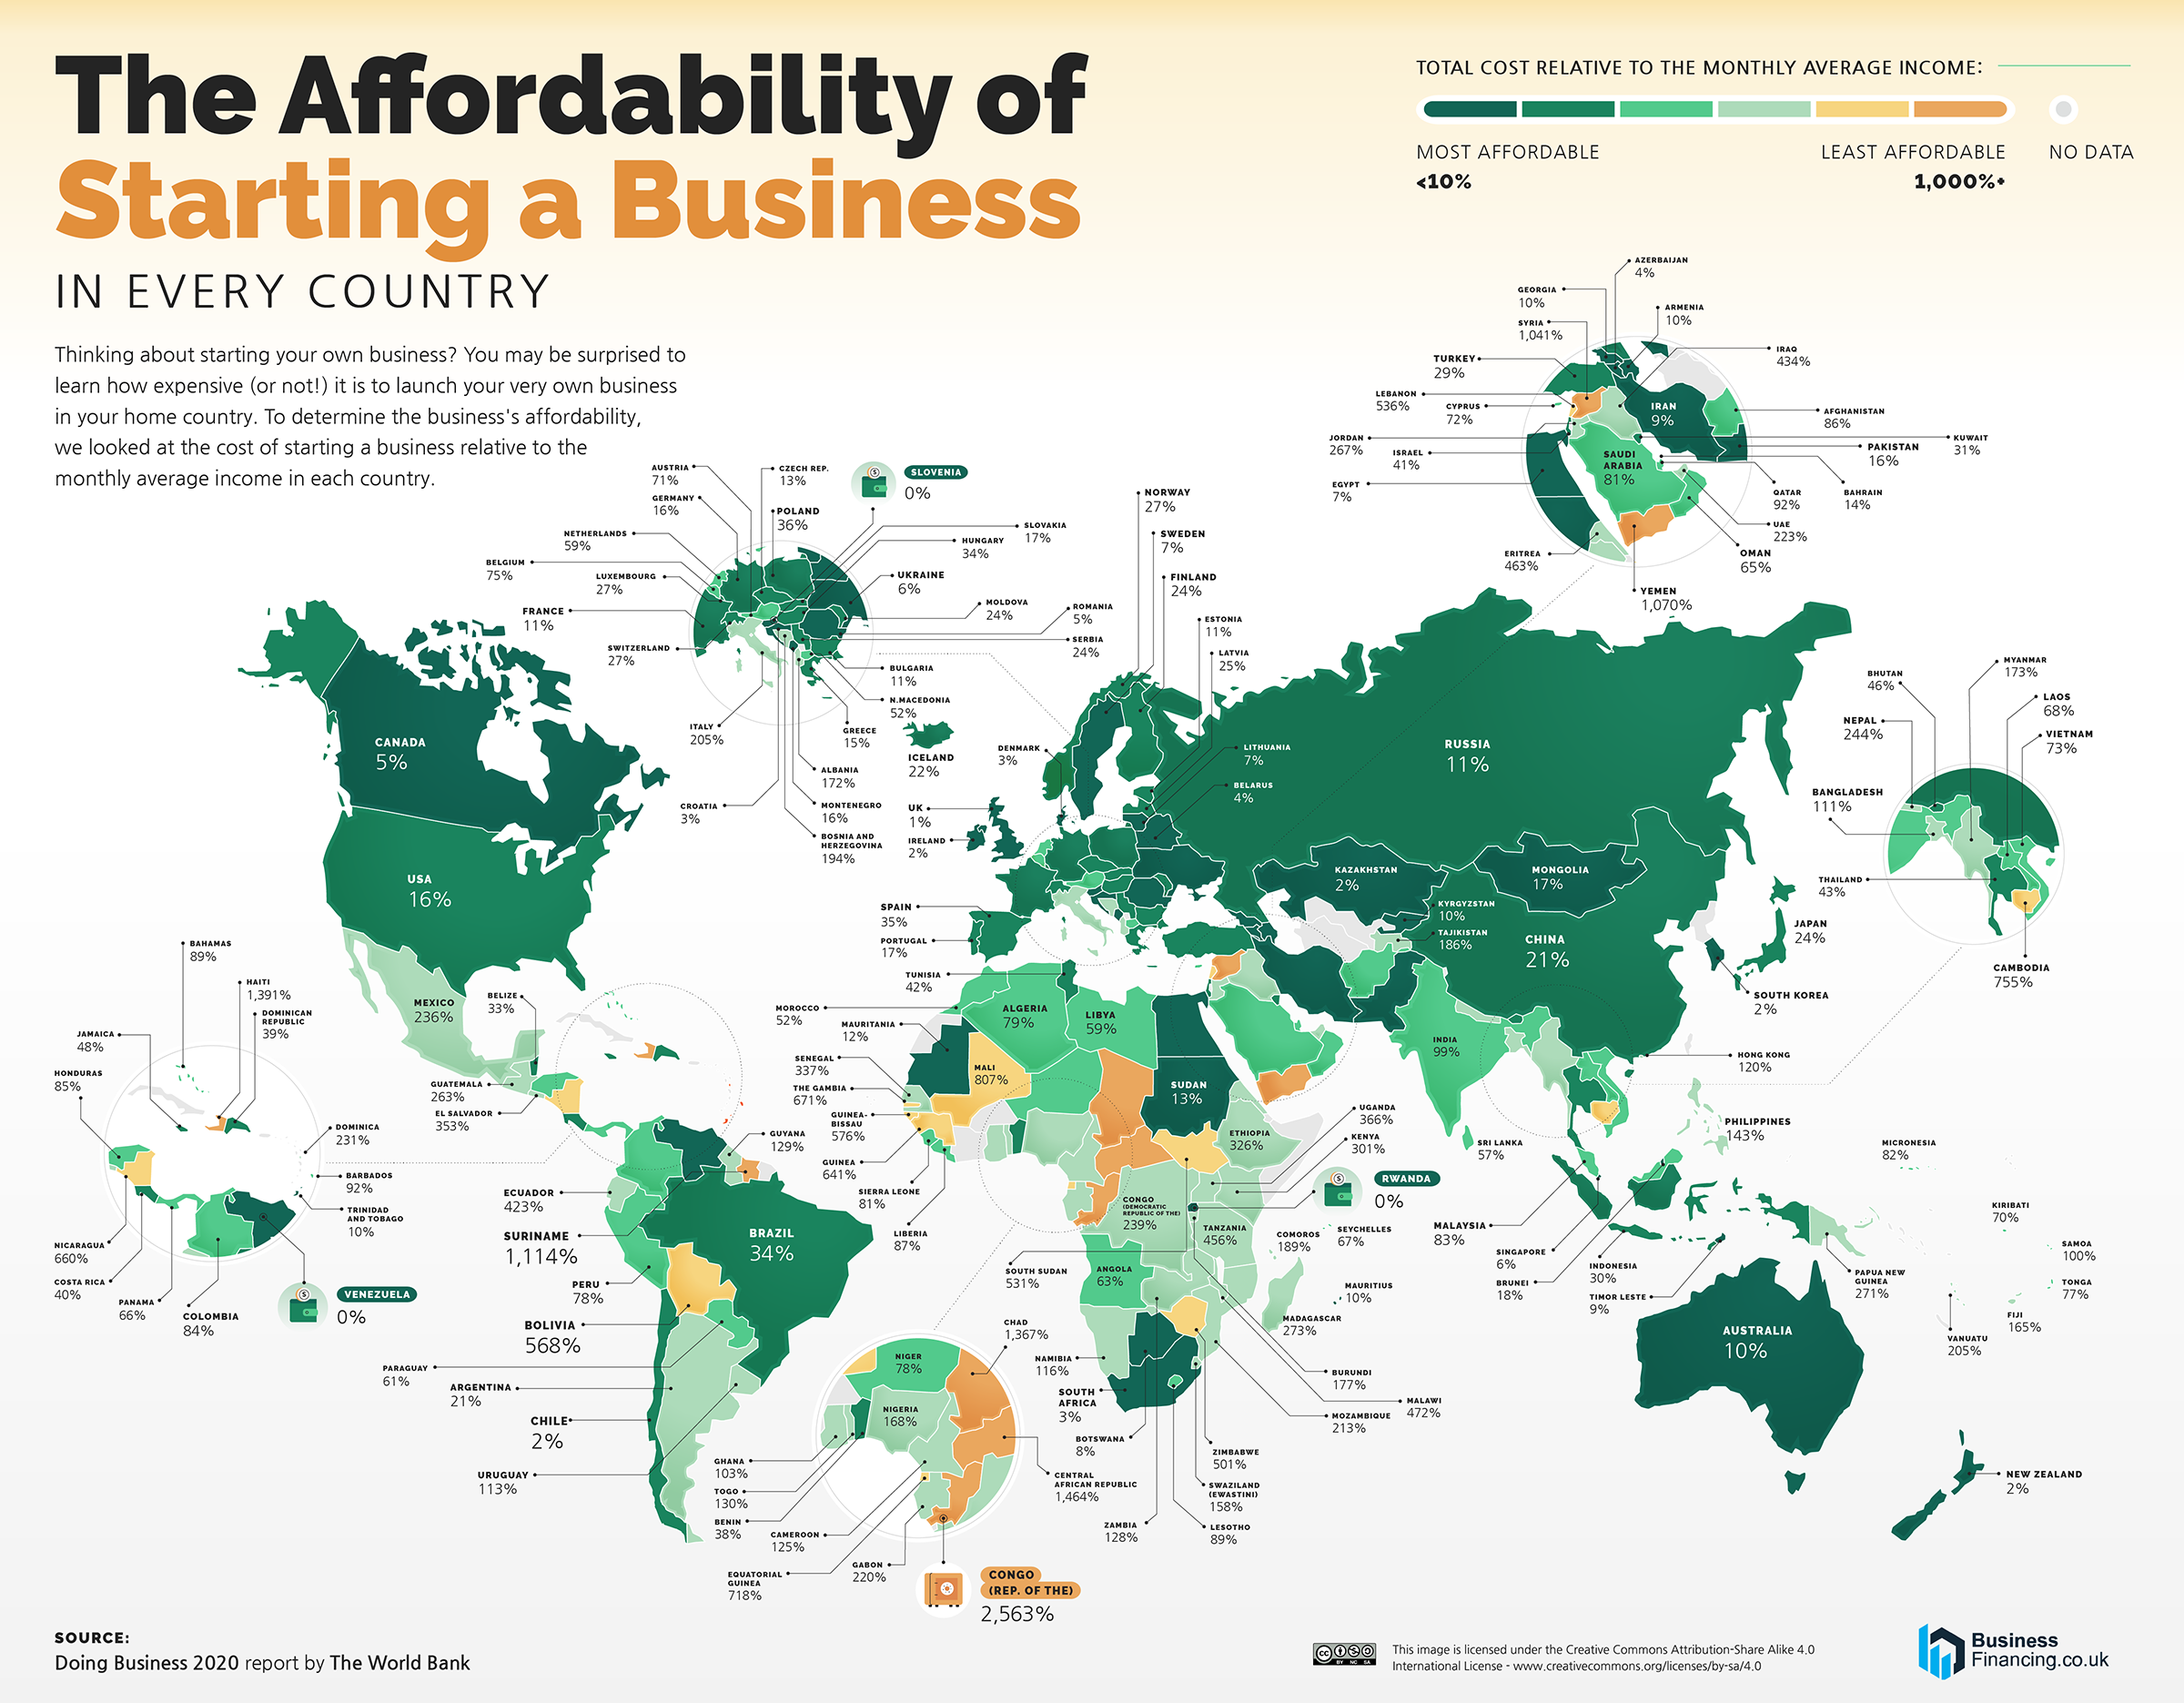
Not including countries with missing data, the most affordable countries for starting a business include the UK, Denmark, and Ireland in Europe, South Korea in East Asia, and New Zealand in Oceania. Startup costs in each range from just 1%-2% of monthly income.
The picture is similar in the Americas, where Chile and Canada have the lowest relative fees at 2% and 5% of monthly income respectively. Even the U.S.—which has a decently high cost of $725 for starting a business—is relatively affordable at 16% of monthly income.
Some of the least affordable countries lie in the Middle-East and Central America. Haiti and Suriname have startup costs that are 1,403% and 1,114% of monthly income, while Yemen has affordability rates of 1,070%.
But the least affordable countries are in Africa. Many countries on the continent have startup costs that are more than 100% of monthly income, but the Republic of the Congo and the Central African Republic have affordability rates of 2,546% and 1,455% of monthly income, respectively.
Where is the best place to start a business? It can depend on the barrier to entry. But the biggest barrier takes time and ingenuity: finding the right idea at the right time.


Misc
The Top 25 Nationalities of U.S. Immigrants
Mexico is the largest source of immigrants to the U.S., with almost 11 million immigrants.


The Top 25 Nationalities of U.S. Immigrants
This was originally posted on our Voronoi app. Download the app for free on iOS or Android and discover incredible data-driven charts from a variety of trusted sources.
The United States is home to more than 46 million immigrants, constituting approximately 14% of its total population.
This graphic displays the top 25 countries of origin for U.S. immigrants, based on 2022 estimates. The data is sourced from the Migration Policy Institute (MPI), which analyzed information from the U.S. Census Bureau’s 2022 American Community Survey.
In this context, “immigrants” refer to individuals residing in the United States who were not U.S. citizens at birth.
Mexico Emerges as a Leading Source of Immigration
Mexico stands out as the largest contributor to U.S. immigration due to its geographical proximity and historical ties.
Various economic factors, including wage disparities and employment opportunities, motivate many Mexicans to seek better prospects north of the border.
| Country | Region | # of Immigrants |
|---|---|---|
| 🇲🇽 Mexico | Latin America & Caribbean | 10,678,502 |
| 🇮🇳 India | Asia | 2,839,618 |
| 🇨🇳 China | Asia | 2,217,894 |
| 🇵🇭 Philippines | Asia | 1,982,333 |
| 🇸🇻 El Salvador | Latin America & Caribbean | 1,407,622 |
| 🇻🇳 Vietnam | Asia | 1,331,192 |
| 🇨🇺 Cuba | Latin America & Caribbean | 1,312,510 |
| 🇩🇴 Dominican Republic | Latin America & Caribbean | 1,279,900 |
| 🇬🇹 Guatemala | Latin America & Caribbean | 1,148,543 |
| 🇰🇷 Korea | Asia | 1,045,100 |
| 🇨🇴 Colombia | Latin America & Caribbean | 928,053 |
| 🇭🇳 Honduras | Latin America & Caribbean | 843,774 |
| 🇨🇦 Canada | Northern America | 821,322 |
| 🇯🇲 Jamaica | Latin America & Caribbean | 804,775 |
| 🇭🇹 Haiti | Latin America & Caribbean | 730,780 |
| 🇬🇧 United Kingdom | Europe | 676,652 |
| 🇻🇪 Venezuela | Latin America & Caribbean | 667,664 |
| 🇧🇷 Brazil | Latin America & Caribbean | 618,525 |
| 🇩🇪 Germany | Europe | 537,484 |
| 🇪🇨 Ecuador | Latin America & Caribbean | 518,287 |
| 🇵🇪 Peru | Latin America & Caribbean | 471,988 |
| 🇳🇬 Nigeria | Africa | 448,405 |
| 🇺🇦 Ukraine | Europe | 427,163 |
| 🇮🇷 Iran | Middle East | 407,283 |
| 🇵🇰 Pakistan | Asia | 399,086 |
| Rest of World | 11,637,634 | |
| Total | 46,182,089 |
Mexicans are followed in this ranking by Indians, Chinese, and Filipinos, though most immigrants on this list come from countries in the Latin American and Caribbean region.
On the other hand, only three European countries are among the top sources of U.S. immigrants: the UK, Germany, and Ukraine.
Immigration continues to be a significant factor contributing to the overall growth of the U.S. population. Overall population growth has decelerated over the past decade primarily due to declining birth rates.
Between 2021 and 2022, the increase in the immigrant population accounted for 65% of the total population growth in the U.S., representing 912,000 individuals out of nearly 1.4 million.
If you enjoyed this post, be sure to check out Visualized: Why Do People Immigrate to the U.S.? This visualization shows the different reasons cited by new arrivals to America in 2021.

-

 Personal Finance1 week ago
Visualizing the Tax Burden of Every U.S. State
-

 Misc6 days ago
Visualized: Aircraft Carriers by Country
-

 Culture7 days ago
How Popular Snack Brand Logos Have Changed
-

 Mining1 week ago
Visualizing Copper Production by Country in 2023
-

 Misc1 week ago
Charted: How Americans Feel About Federal Government Agencies
-

 Healthcare1 week ago
Which Countries Have the Highest Infant Mortality Rates?
-

 Demographics1 week ago
Mapped: U.S. Immigrants by Region
-

 Maps1 week ago
Mapped: Southeast Asia’s GDP Per Capita, by Country