Markets
Walmart Nation: Mapping America’s Biggest Employers
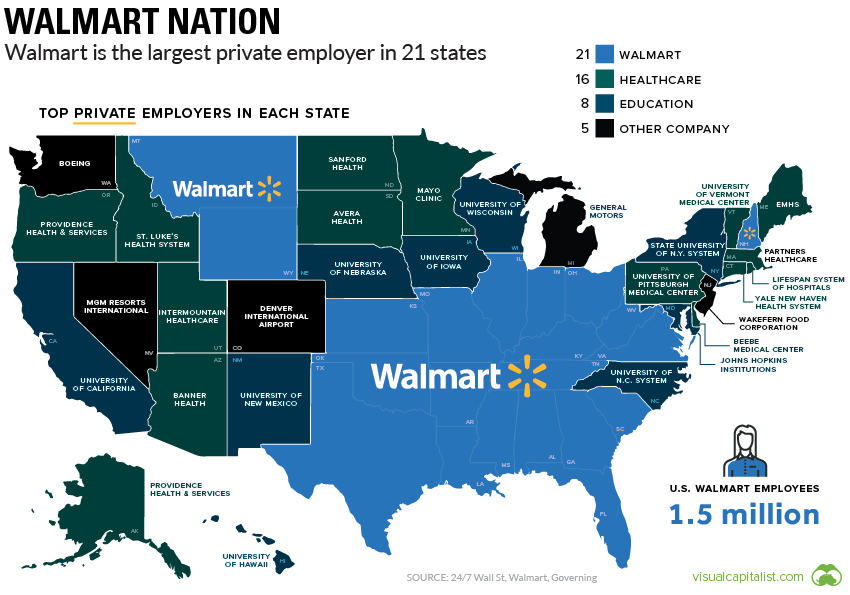
Walmart Nation: Mapping America’s Biggest Employers
In America, approximately 150 million people are currently employed, doing everything from neurosurgery to greeting customers at your local Walmart Supercenter.
While there is a breathtaking variety of jobs out there, a few large-scale organizations stand out as the top employer in each state.
The Largest Employer in Each State
The U.S. is the third most populous country in the world, so it takes a lot of manpower to keep the government running. It’ll come as no surprise that, in most states, either the state or federal government is the top employer. California alone employs a quarter of a million federal workers.
New York State is a unique case as NYC’s municipal workforce is the top employer.
Technically, the largest employer on the planet is the U.S. Department of Defense, and in eight states, there are more active military personnel than any single private employer.
Non-Government Employers
When we exclude direct government and military employment, a few trends emerge. Universities and hospitals – there is often some overlap between the two – are top employers in nearly half of the states.
In a handful of cases, the top employer reflects an industry that is well known in the region. General Motors, for example, is still the top employer in Michigan. In Nevada? MGM Resorts International, with over 55,000 employees.
When it comes to large-scale employment, there’s one regional trend that stands out the most – the broad blue expanse of Walmart country.
View the high resolution version of today’s graphic by clicking here.
Walmart Nation
Walmart is the biggest company in the world by revenue, and there are over 3,500 Walmart Supercenters spread around the United States alone. It takes about 1% of private sector workforce in the United States to keep this massive fleet of big box stores running. In Arkansas, that figure jumps up to 4%, with about one-third of the total retail workforce employed at the retail giant.
Here’s a full look at the 21 states where Walmart is the top employer.
| State | # of Walmart Employees |
|---|---|
| Texas | 168,403 |
| Florida | 107,460 |
| Georgia | 60,002 |
| Illinois | 53,687 |
| Arkansas | 52,367 |
| Ohio | 50,186 |
| Virginia | 43,623 |
| Missouri | 42,029 |
| Tennessee | 40,598 |
| Indiana | 39,875 |
| Alabama | 37,207 |
| Louisiana | 36,309 |
| Oklahoma | 32,713 |
| South Carolina | 32,165 |
| Kentucky | 29,554 |
| Mississippi | 24,180 |
| Kansas | 20,103 |
| West Virginia | 11,864 |
| New Hampshire | 7,593 |
| Montana | 4,861 |
| Wyoming | 4,648 |
What About Amazon?
When we talk about the retail industry, it’s impossible to avoid discussing Amazon. The e-commerce company is growing at an impressive clip, and is now the second largest private employer in the country, with over half a million employees.
That said, even with the acquisition of Whole Foods, Amazon still has a long way to go to catch up to Walmart’s massive employee count. The company’s reliance on contract workers and supply chain automation means that this map is unlikely to turn orange in the near future.


Markets
Mapped: Europe’s GDP Per Capita, by Country
Which European economies are richest on a GDP per capita basis? This map shows the results for 44 countries across the continent.


Mapped: Europe’s GDP Per Capita, by Country (2024)
This was originally posted on our Voronoi app. Download the app for free on iOS or Android and discover incredible data-driven charts from a variety of trusted sources.
Europe is home to some of the largest and most sophisticated economies in the world. But how do countries in the region compare with each other on a per capita productivity basis?
In this map, we show Europe’s GDP per capita levels across 44 nations in current U.S. dollars. Data for this visualization and article is sourced from the International Monetary Fund (IMF) via their DataMapper tool, updated April 2024.
Europe’s Richest and Poorest Nations, By GDP Per Capita
Luxembourg, Ireland, and Switzerland, lead the list of Europe’s richest nations by GDP per capita, all above $100,000.
| Rank | Country | GDP Per Capita (2024) |
|---|---|---|
| 1 | 🇱🇺 Luxembourg | $131,380 |
| 2 | 🇮🇪 Ireland | $106,060 |
| 3 | 🇨🇭 Switzerland | $105,670 |
| 4 | 🇳🇴 Norway | $94,660 |
| 5 | 🇮🇸 Iceland | $84,590 |
| 6 | 🇩🇰 Denmark | $68,900 |
| 7 | 🇳🇱 Netherlands | $63,750 |
| 8 | 🇸🇲 San Marino | $59,410 |
| 9 | 🇦🇹 Austria | $59,230 |
| 10 | 🇸🇪 Sweden | $58,530 |
| 11 | 🇧🇪 Belgium | $55,540 |
| 12 | 🇫🇮 Finland | $55,130 |
| 13 | 🇩🇪 Germany | $54,290 |
| 14 | 🇬🇧 UK | $51,070 |
| 15 | 🇫🇷 France | $47,360 |
| 16 | 🇦🇩 Andorra | $44,900 |
| 17 | 🇲🇹 Malta | $41,740 |
| 18 | 🇮🇹 Italy | $39,580 |
| 19 | 🇨🇾 Cyprus | $37,150 |
| 20 | 🇪🇸 Spain | $34,050 |
| 21 | 🇸🇮 Slovenia | $34,030 |
| 22 | 🇪🇪 Estonia | $31,850 |
| 23 | 🇨🇿 Czech Republic | $29,800 |
| 24 | 🇵🇹 Portugal | $28,970 |
| 25 | 🇱🇹 Lithuania | $28,410 |
| 26 | 🇸🇰 Slovakia | $25,930 |
| 27 | 🇱🇻 Latvia | $24,190 |
| 28 | 🇬🇷 Greece | $23,970 |
| 29 | 🇭🇺 Hungary | $23,320 |
| 30 | 🇵🇱 Poland | $23,010 |
| 31 | 🇭🇷 Croatia | $22,970 |
| 32 | 🇷🇴 Romania | $19,530 |
| 33 | 🇧🇬 Bulgaria | $16,940 |
| 34 | 🇷🇺 Russia | $14,390 |
| 35 | 🇹🇷 Türkiye | $12,760 |
| 36 | 🇲🇪 Montenegro | $12,650 |
| 37 | 🇷🇸 Serbia | $12,380 |
| 38 | 🇦🇱 Albania | $8,920 |
| 39 | 🇧🇦 Bosnia & Herzegovina | $8,420 |
| 40 | 🇲🇰 North Macedonia | $7,690 |
| 41 | 🇧🇾 Belarus | $7,560 |
| 42 | 🇲🇩 Moldova | $7,490 |
| 43 | 🇽🇰 Kosovo | $6,390 |
| 44 | 🇺🇦 Ukraine | $5,660 |
| N/A | 🇪🇺 EU Average | $44,200 |
Note: Figures are rounded.
Three Nordic countries (Norway, Iceland, Denmark) also place highly, between $70,000-90,000. Other Nordic peers, Sweden and Finland rank just outside the top 10, between $55,000-60,000.
Meanwhile, Europe’s biggest economies in absolute terms, Germany, UK, and France, rank closer to the middle of the top 20, with GDP per capitas around $50,000.
Finally, at the end of the scale, Eastern Europe as a whole tends to have much lower per capita GDPs. In that group, Ukraine ranks last, at $5,660.
A Closer Look at Ukraine
For a broader comparison, Ukraine’s per capita GDP is similar to Iran ($5,310), El Salvador ($5,540), and Guatemala ($5,680).
According to experts, Ukraine’s economy has historically underperformed to expectations. After the fall of the Berlin Wall, the economy contracted for five straight years. Its transition to a Western, liberalized economic structure was overshadowed by widespread corruption, a limited taxpool, and few revenue sources.
Politically, its transformation from authoritarian regime to civil democracy has proved difficult, especially when it comes to institution building.
Finally, after the 2022 invasion of the country, Ukraine’s GDP contracted by 30% in a single year—the largest loss since independence. Large scale emigration—to the tune of six million refugees—is also playing a role.
Despite these challenges, the country’s economic growth has somewhat stabilized while fighting continues.

-

 Markets6 days ago
Visualized: Interest Rate Forecasts for Advanced Economies
-

 Markets2 weeks ago
Economic Growth Forecasts for G7 and BRICS Countries in 2024
-

 Wealth2 weeks ago
Charted: Which City Has the Most Billionaires in 2024?
-

 Technology2 weeks ago
All of the Grants Given by the U.S. CHIPS Act
-

 Green2 weeks ago
The Carbon Footprint of Major Travel Methods
-

 United States1 week ago
Visualizing the Most Common Pets in the U.S.
-

 Culture1 week ago
The World’s Top Media Franchises by All-Time Revenue
-

 voronoi1 week ago
Best Visualizations of April on the Voronoi App