Misc
Visualizing the Odds of Dying from Various Accidents
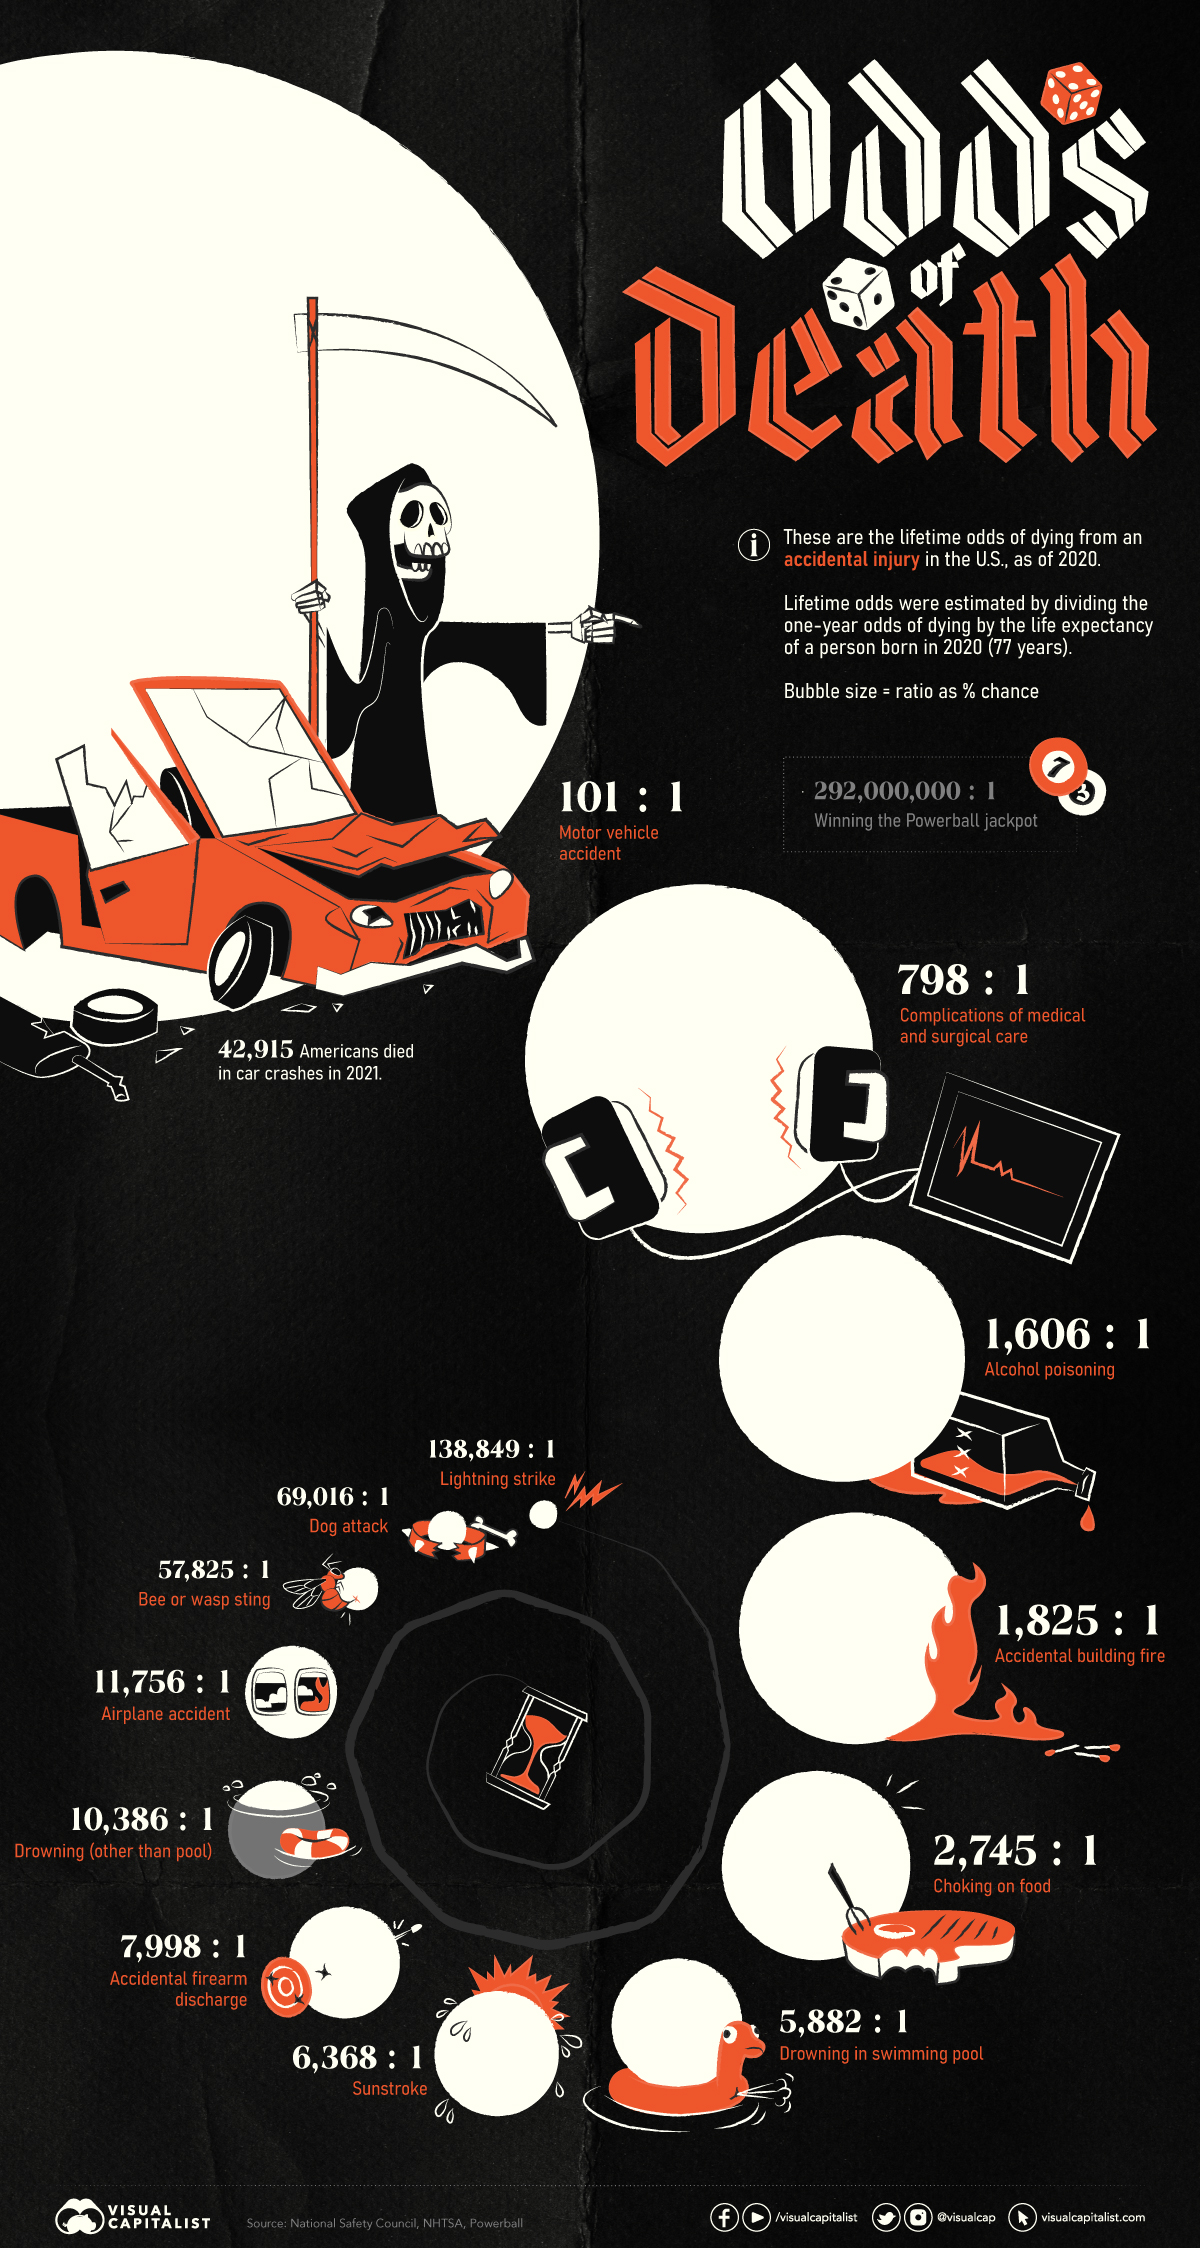


Infographic: The Odds of Dying from Various Accidents
Fatal accidents account for a significant number of deaths in the U.S. every year. For example, nearly 43,000 Americans died in traffic accidents in 2021.
Without the right context, however, it can be difficult to properly interpret these figures.
To help you understand your chances, we’ve compiled data from the National Safety Council, and visualized the lifetime odds of dying from various accidents.
Data and Methodology
The lifetime odds presented in this graphic were estimated by dividing the one-year odds of dying by the life expectancy of a person born in 2020 (77 years).
Additionally, these numbers are based on data from the U.S., and likely differ in other countries.
| Type of Accident | Lifetime odds of dying (1 in #) |
|---|---|
| Motor vehicle accident | 101 |
| Complications of medical and surgical care | 798 |
| Alcohol poisoning | 1,606 |
| Accidental building fire | 1,825 |
| Choking on food | 2,745 |
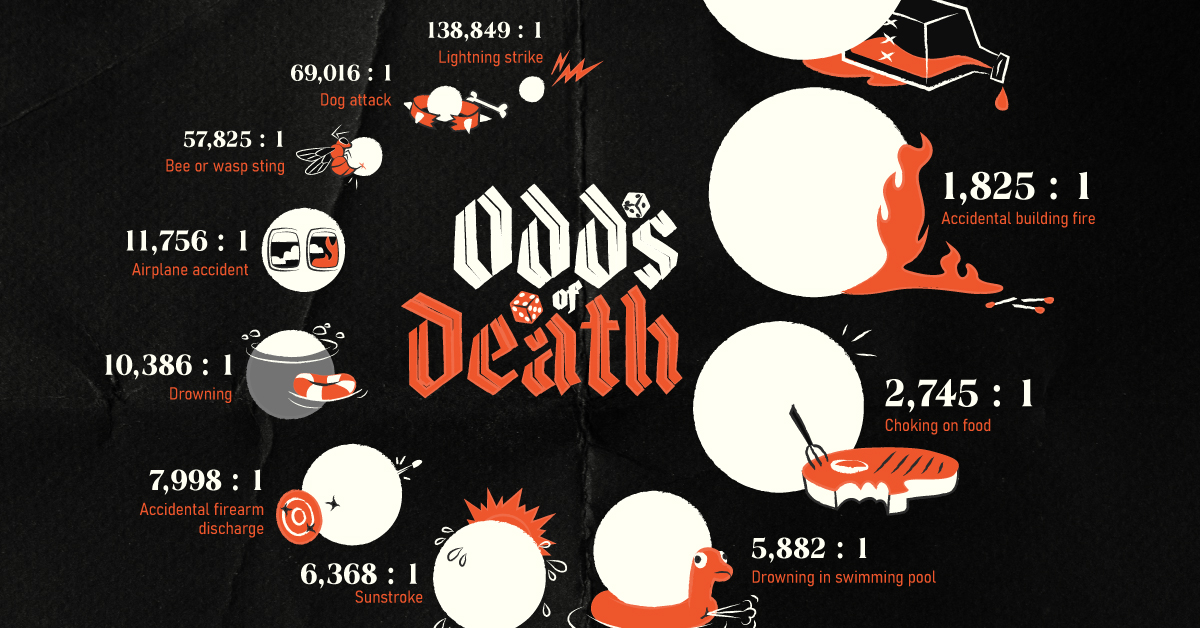
| Drowning in swimming pool | 5,782 |
| Sunstroke | 6,368 |
| Accidental firearm discharge | 7,998 |
| Drowning | 10,386 |
| Airplane accident | 11,756 |
| Bee or wasp sting | 57,825 |
| Dog attack | 69,016 |
| Lightning strike | 138,849 |
For comparison’s sake, the odds of winning the Powerball jackpot are 1 in 292,000,000. In other words, you are 4000x more likely to die by a lightning strike over your lifetime than to win the Powerball lottery.
Continue reading below for further context on some of these accidents.
Motor Vehicle Accidents
Motor vehicle accidents are a leading cause of accidental deaths in the U.S., with a 1 in 101 chance of dying. This is quite a common way of dying, especially when compared to something like bee stings (1 in 57,825).
Unfortunately, a major cause of vehicle deaths is impaired driving. The CDC reports that 32 Americans are killed every day in crashes involving alcohol, which equates to one death every 45 minutes.
For further context, consider this: 30% of all traffic-related deaths in 2020 involved alcohol-impaired drivers.
Drowning
The odds of drowning in a swimming pool (1 in 5,782) are significantly higher than those of drowning in general (1 in 10,386). According to the CDC, there are 4,000 fatal drownings every year, which works out to 11 deaths per day.
Drowning also happens to be a leading cause of death for children. It is the leading cause for kids aged 1-4, and second highest cause for kids aged 5-14.
A rather surprising fact about drowning is that 80% of fatalities are male. This has been attributed to higher rates of alcohol use and risk-taking behaviors.
Accidental Firearm Discharge
Lastly, let’s look at accidental firearm deaths, which have lifetime odds of 1 in 7,998. That’s higher than the odds of drowning (general), as well as dying in an airplane accident.
This shouldn’t come as a major surprise, since the U.S. has the highest rates of gun ownership in the world. More importantly, these odds highlight the importance of properly securing one’s firearms, as well as learning safe handling practices.
As a percentage of total gun-related deaths (45,222 in 2020), accidental shootings represent a tiny 1%. The two leading causes are suicide (54%) and homicide (43%).
Interested in learning more about death? Revisit one of our most popular posts of all time: Visualizing the History of Pandemics.


Misc
Visualizing the Most Common Pets in the U.S.
Lions, tigers, and bears, oh my!—these animals do not feature on this list of popular American household pets.


Visualizing The Most Common Pets in the U.S.
This was originally posted on our Voronoi app. Download the app for free on iOS or Android and discover incredible data-driven charts from a variety of trusted sources.
In this graphic, we visualized the most common American household pets, based on 2023-2024 data from the American Pet Products Association (accessed via Forbes Advisor).
Figures represent the number of households that own each pet type, rather than the actual number of each animal. The “small animal” category includes hamsters, gerbils, rabbits, guinea pigs, chinchillas, mice, rats, and ferrets.
What is the Most Popular American Household Pet?
Based on this data, dogs—one of the first domesticated animals—are the most common pets in the United States. In fact, around 65 million households own a dog, and spend an average of $900 a year on their care.
| Rank | Species | Households |
|---|---|---|
| 1 | 🐶 Dog | 65M |
| 2 | 🐱 Cat | 47M |
| 3 | 🐟 Freshwater Fish | 11M |
| 4 | 🐰 Small Animals | 7M |
| 5 | 🐦 Bird | 6M |
| 6 | 🦎 Reptile | 6M |
| 7 | 🐴 Horse | 2M |
| 8 | 🐠 Saltwater Fish | 2M |
Note: Households can own multiple pets, and are counted for all relevant categories.
Cats rank second, at 47 million households, and these smaller felines are a little less expensive to own at $700/year according to Forbes estimates.
But aside from these two juggernauts, there are plenty of other common pet types found in households across the country.
Freshwater fish can be found in 11 million households, along with small animals—rabbits, hamsters, guinea pigs—in 7 million. Meanwhile, nearly 6 million homes have birds or reptiles.
Pet Ownership is on the Rise in America
Forbes found that 66% of all American households (numbering 87 million) own at least one pet, up from 56% in 1988. One third of these (29 million) own multiple pets.
A combination of factors is driving this increase: rising incomes, delayed childbirth, and of course the impact of the pandemic which nearly cleared out animal shelters across the globe.
America’s loneliness epidemic may also be a factor. Fledgling research has shown that single-individual households with pets recorded lower rates of loneliness during the pandemic than those without a pet.

-

 Demographics7 days ago
The Countries That Have Become Sadder Since 2010
-

 Green2 weeks ago
Ranked: The Countries With the Most Air Pollution in 2023
-

 Green2 weeks ago
Ranking the Top 15 Countries by Carbon Tax Revenue
-

 Markets2 weeks ago
U.S. Debt Interest Payments Reach $1 Trillion
-

 Mining2 weeks ago
Gold vs. S&P 500: Which Has Grown More Over Five Years?
-

 Energy2 weeks ago
The World’s Biggest Nuclear Energy Producers
-

 Misc2 weeks ago
How Hard Is It to Get Into an Ivy League School?
-

 Debt2 weeks ago
How Debt-to-GDP Ratios Have Changed Since 2000