Markets
Visualizing the Composition of the World Economy by GDP (PPP)

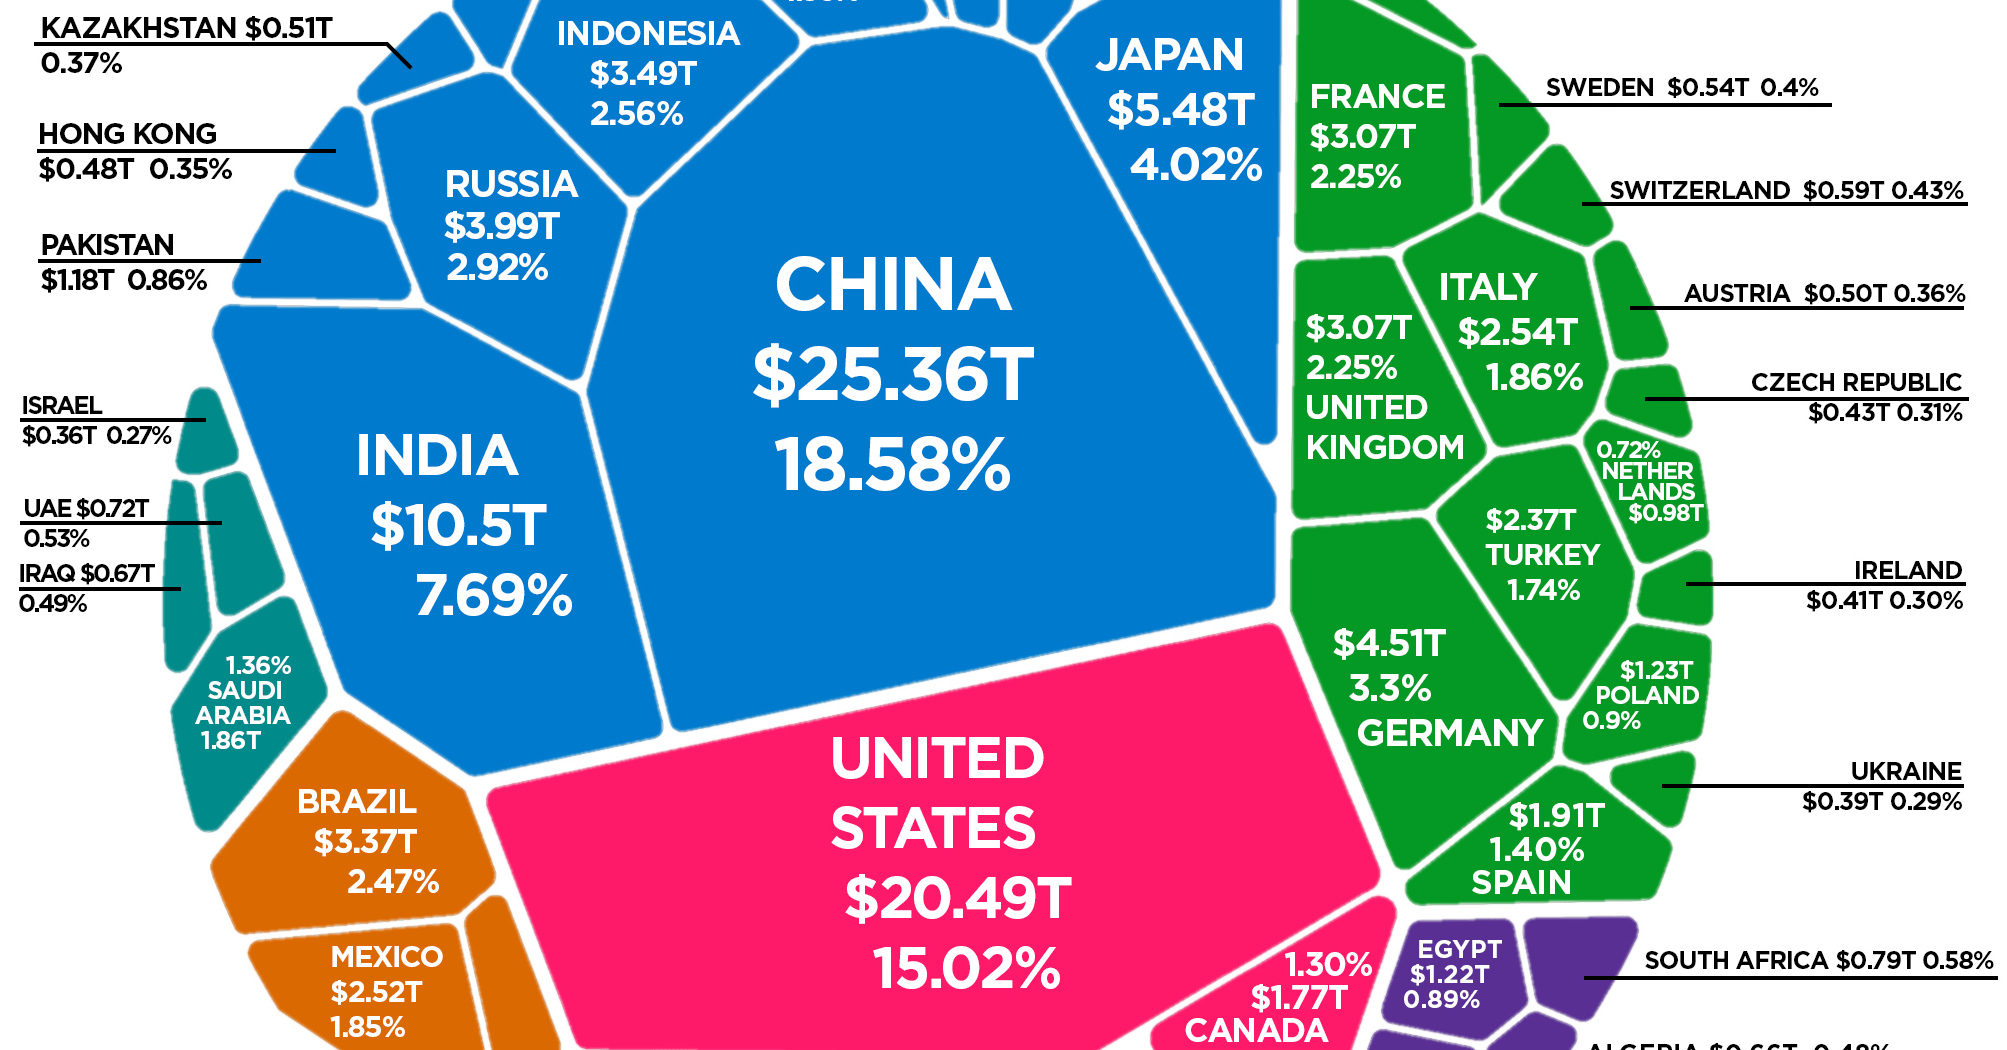
The Composition of the World Economy by GDP (PPP)
Earlier this month, we showed you the world’s $86 trillion economy broken down by country, using nominal GDP calculations.
While this is one useful way to view the global economic picture, it’s not the only way.
Today’s visualization, which comes to us from HowMuch.net, is similar in that it also uses a Voronoi diagram to display the composition of the world economy by GDP. However, by adjusting data for purchasing power parity (PPP), it produces a very different view of how global productivity breaks down.
What is PPP?
Purchasing power parity, or PPP, is an economic theory that can be applied to adjust the prices of goods in a given market.
In essence, instead of using current market rates for prices (such as in nominal data), PPP tries to more accurately account for differences in the cost of living between countries – especially in places where labor and goods are far cheaper.
When applied to GDP measurements, PPP can help provide a more accurate picture of actual productivity. For example, a taxi ride in Bolivia may be far cheaper than one in New York City, even though it is the same service provided over the same distance.
Applying PPP to GDP figures can help correct for these types of differences.
Ranked: Economies by GDP (PPP)
After adjusting for PPP, how does the composition of the global economy change from the nominal numbers?
Below are the 15 largest economies by GDP (PPP), as well as how their ranking changed from the previous chart, which used nominal data.
| Rank | Country | GDP (2018, PPP) | Share of World Total | Change (vs. nominal rank) |
|---|---|---|---|---|
| #1 | 🇨🇳 China | $25.4 trillion | 18.6% | +1 |
| #2 | 🇺🇸 United States | $20.5 trillion | 15.0% | -1 |
| #3 | 🇮🇳 India | $10.5 trillion | 7.7% | +4 |
| #4 | 🇯🇵 Japan | $5.5 trillion | 4.0% | -1 |
| #5 | 🇩🇪 Germany | $4.5 trillion | 3.3% | -1 |
| #6 | 🇷🇺 Russia | $4.0 trillion | 2.9% | +5 |
| #7 | 🇮🇩 Indonesia | $3.5 trillion | 2.6% | +9 |
| #8 | 🇧🇷 Brazil | $3.4 trillion | 2.5% | +1 |
| #9 | 🇬🇧 United Kingdom | $3.1 trillion | 2.3% | -4 |
| #10 | 🇫🇷 France | $3.1 trillion | 2.3% | -4 |
| #11 | 🇮🇹 Italy | $2.5 trillion | 1.9% | -3 |
| #12 | 🇲🇽 Mexico | $2.5 trillion | 1.9% | +3 |
| #13 | 🇹🇷 Turkey | $2.4 trillion | 1.7% | +6 |
| #14 | 🇰🇷 Korea, Rep. | $2.1 trillion | 1.5% | -2 |
| #15 | 🇪🇸 Spain | $1.9 trillion | 1.4% | -1 |
Using GDP (PPP), the world economy is worth $136.5 trillion in current international U.S. dollars.
What changed the most from the nominal ranking?
With PPP, you can see Indonesia ($3.5 trillion) jumps up the ranking by nine spots to become the #7 ranked economy. Likewise, Turkey ($2.4 trillion) and India ($10.5 trillion) both climb the ranking by six and four spots respectively. China also switches with the U.S., to become the world’s largest economy.
On the flipside, it is often the more developed economies with strong currencies that see a drop in their rankings. After adjusting for PPP, the United States, Japan, Germany, France, Italy, South Korea, Spain, and the U.K. all slip from their previous positions.
For more on GDP (PPP), see the projections for the world’s largest 10 economies in 2030 that we published earlier this year.


Markets
Mapped: Europe’s GDP Per Capita, by Country
Which European economies are richest on a GDP per capita basis? This map shows the results for 44 countries across the continent.


Mapped: Europe’s GDP Per Capita, by Country (2024)
This was originally posted on our Voronoi app. Download the app for free on iOS or Android and discover incredible data-driven charts from a variety of trusted sources.
Europe is home to some of the largest and most sophisticated economies in the world. But how do countries in the region compare with each other on a per capita productivity basis?
In this map, we show Europe’s GDP per capita levels across 44 nations in current U.S. dollars. Data for this visualization and article is sourced from the International Monetary Fund (IMF) via their DataMapper tool, updated April 2024.
Europe’s Richest and Poorest Nations, By GDP Per Capita
Luxembourg, Ireland, and Switzerland, lead the list of Europe’s richest nations by GDP per capita, all above $100,000.
| Rank | Country | GDP Per Capita (2024) |
|---|---|---|
| 1 | 🇱🇺 Luxembourg | $131,380 |
| 2 | 🇮🇪 Ireland | $106,060 |
| 3 | 🇨🇭 Switzerland | $105,670 |
| 4 | 🇳🇴 Norway | $94,660 |
| 5 | 🇮🇸 Iceland | $84,590 |
| 6 | 🇩🇰 Denmark | $68,900 |
| 7 | 🇳🇱 Netherlands | $63,750 |
| 8 | 🇸🇲 San Marino | $59,410 |
| 9 | 🇦🇹 Austria | $59,230 |
| 10 | 🇸🇪 Sweden | $58,530 |
| 11 | 🇧🇪 Belgium | $55,540 |
| 12 | 🇫🇮 Finland | $55,130 |
| 13 | 🇩🇪 Germany | $54,290 |
| 14 | 🇬🇧 UK | $51,070 |
| 15 | 🇫🇷 France | $47,360 |
| 16 | 🇦🇩 Andorra | $44,900 |
| 17 | 🇲🇹 Malta | $41,740 |
| 18 | 🇮🇹 Italy | $39,580 |
| 19 | 🇨🇾 Cyprus | $37,150 |
| 20 | 🇪🇸 Spain | $34,050 |
| 21 | 🇸🇮 Slovenia | $34,030 |
| 22 | 🇪🇪 Estonia | $31,850 |
| 23 | 🇨🇿 Czech Republic | $29,800 |
| 24 | 🇵🇹 Portugal | $28,970 |
| 25 | 🇱🇹 Lithuania | $28,410 |
| 26 | 🇸🇰 Slovakia | $25,930 |
| 27 | 🇱🇻 Latvia | $24,190 |
| 28 | 🇬🇷 Greece | $23,970 |
| 29 | 🇭🇺 Hungary | $23,320 |
| 30 | 🇵🇱 Poland | $23,010 |
| 31 | 🇭🇷 Croatia | $22,970 |
| 32 | 🇷🇴 Romania | $19,530 |
| 33 | 🇧🇬 Bulgaria | $16,940 |
| 34 | 🇷🇺 Russia | $14,390 |
| 35 | 🇹🇷 Türkiye | $12,760 |
| 36 | 🇲🇪 Montenegro | $12,650 |
| 37 | 🇷🇸 Serbia | $12,380 |
| 38 | 🇦🇱 Albania | $8,920 |
| 39 | 🇧🇦 Bosnia & Herzegovina | $8,420 |
| 40 | 🇲🇰 North Macedonia | $7,690 |
| 41 | 🇧🇾 Belarus | $7,560 |
| 42 | 🇲🇩 Moldova | $7,490 |
| 43 | 🇽🇰 Kosovo | $6,390 |
| 44 | 🇺🇦 Ukraine | $5,660 |
| N/A | 🇪🇺 EU Average | $44,200 |
Note: Figures are rounded.
Three Nordic countries (Norway, Iceland, Denmark) also place highly, between $70,000-90,000. Other Nordic peers, Sweden and Finland rank just outside the top 10, between $55,000-60,000.
Meanwhile, Europe’s biggest economies in absolute terms, Germany, UK, and France, rank closer to the middle of the top 20, with GDP per capitas around $50,000.
Finally, at the end of the scale, Eastern Europe as a whole tends to have much lower per capita GDPs. In that group, Ukraine ranks last, at $5,660.
A Closer Look at Ukraine
For a broader comparison, Ukraine’s per capita GDP is similar to Iran ($5,310), El Salvador ($5,540), and Guatemala ($5,680).
According to experts, Ukraine’s economy has historically underperformed to expectations. After the fall of the Berlin Wall, the economy contracted for five straight years. Its transition to a Western, liberalized economic structure was overshadowed by widespread corruption, a limited taxpool, and few revenue sources.
Politically, its transformation from authoritarian regime to civil democracy has proved difficult, especially when it comes to institution building.
Finally, after the 2022 invasion of the country, Ukraine’s GDP contracted by 30% in a single year—the largest loss since independence. Large scale emigration—to the tune of six million refugees—is also playing a role.
Despite these challenges, the country’s economic growth has somewhat stabilized while fighting continues.

-

 Markets6 days ago
Visualized: Interest Rate Forecasts for Advanced Economies
-

 Markets2 weeks ago
Economic Growth Forecasts for G7 and BRICS Countries in 2024
-

 Wealth2 weeks ago
Charted: Which City Has the Most Billionaires in 2024?
-

 Technology2 weeks ago
All of the Grants Given by the U.S. CHIPS Act
-

 Green2 weeks ago
The Carbon Footprint of Major Travel Methods
-

 United States1 week ago
Visualizing the Most Common Pets in the U.S.
-

 Culture1 week ago
The World’s Top Media Franchises by All-Time Revenue
-

 Best of1 week ago
Best Visualizations of April on the Voronoi App