Markets
Visualizing the Composition of the World Economy by GDP (PPP)

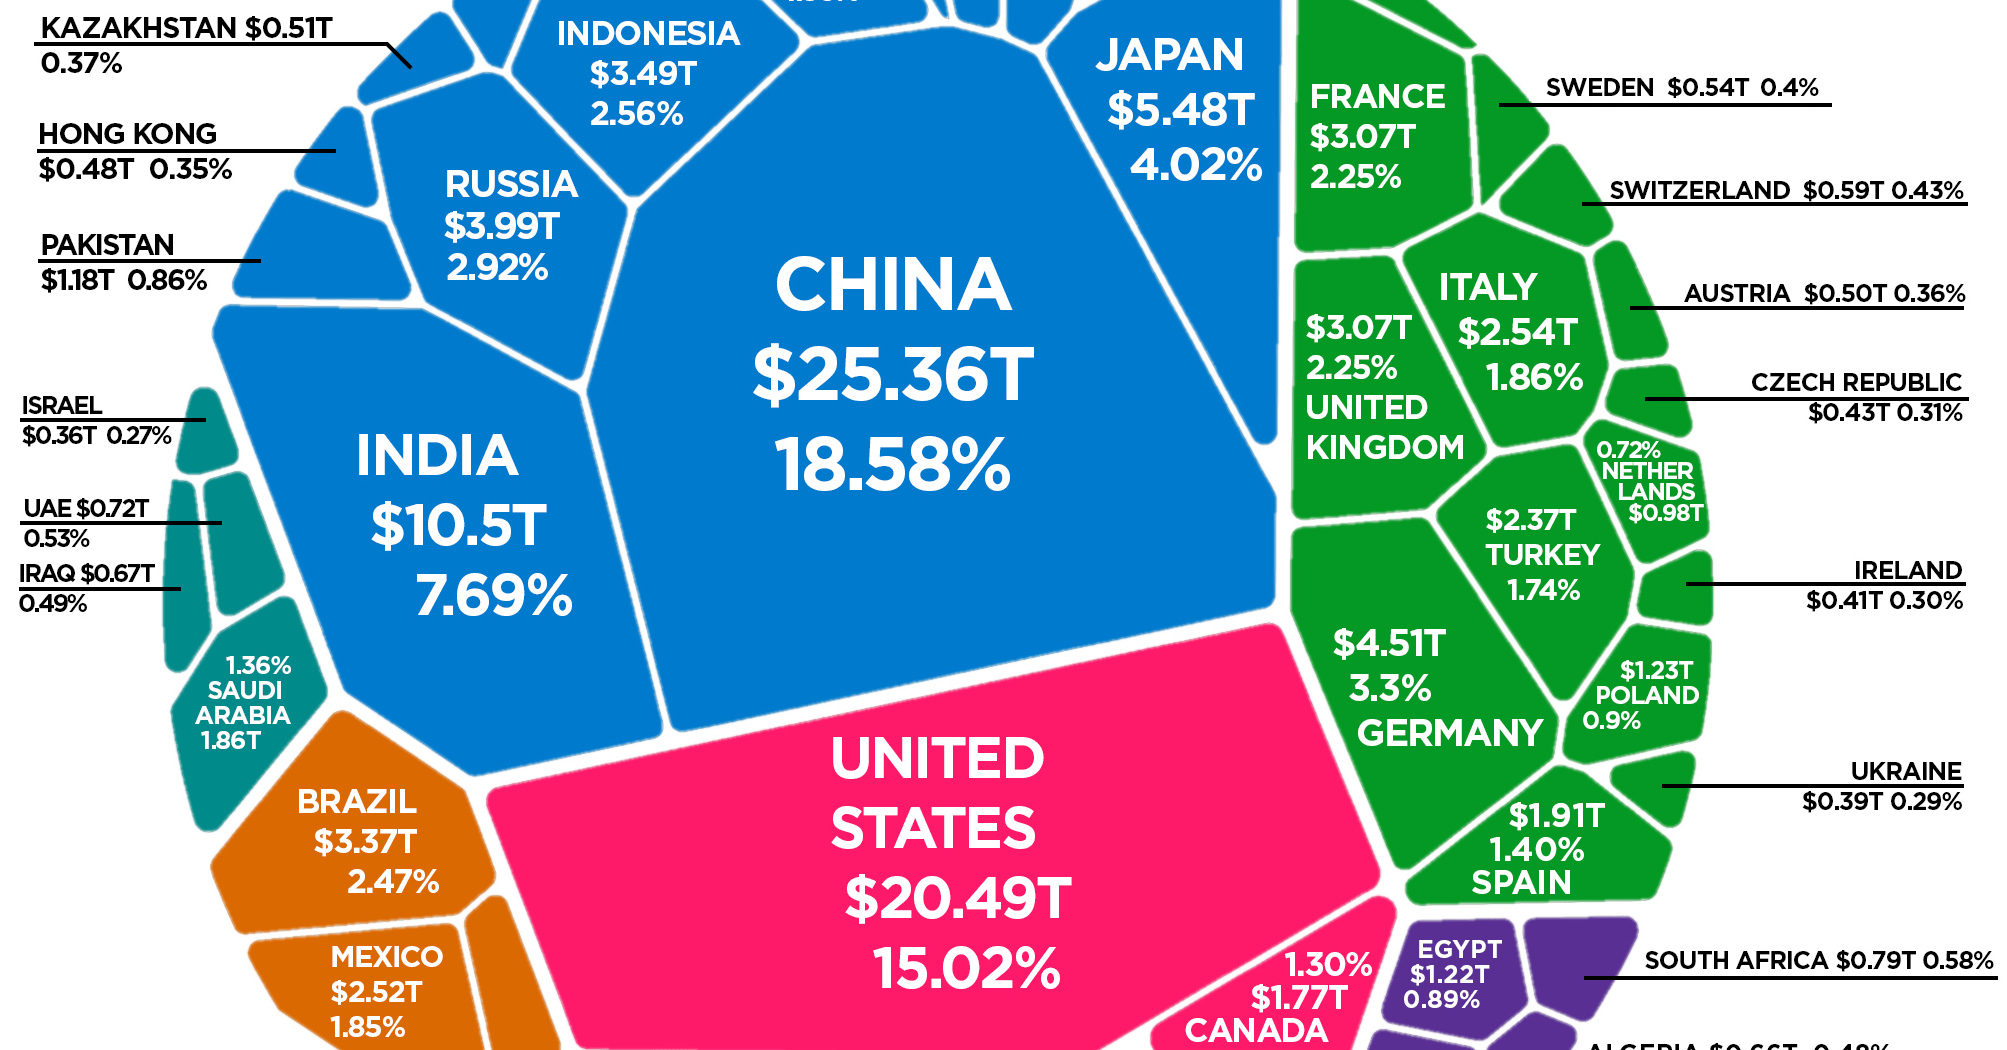
The Composition of the World Economy by GDP (PPP)
Earlier this month, we showed you the world’s $86 trillion economy broken down by country, using nominal GDP calculations.
While this is one useful way to view the global economic picture, it’s not the only way.
Today’s visualization, which comes to us from HowMuch.net, is similar in that it also uses a Voronoi diagram to display the composition of the world economy by GDP. However, by adjusting data for purchasing power parity (PPP), it produces a very different view of how global productivity breaks down.
What is PPP?
Purchasing power parity, or PPP, is an economic theory that can be applied to adjust the prices of goods in a given market.
In essence, instead of using current market rates for prices (such as in nominal data), PPP tries to more accurately account for differences in the cost of living between countries – especially in places where labor and goods are far cheaper.
When applied to GDP measurements, PPP can help provide a more accurate picture of actual productivity. For example, a taxi ride in Bolivia may be far cheaper than one in New York City, even though it is the same service provided over the same distance.
Applying PPP to GDP figures can help correct for these types of differences.
Ranked: Economies by GDP (PPP)
After adjusting for PPP, how does the composition of the global economy change from the nominal numbers?
Below are the 15 largest economies by GDP (PPP), as well as how their ranking changed from the previous chart, which used nominal data.
| Rank | Country | GDP (2018, PPP) | Share of World Total | Change (vs. nominal rank) |
|---|---|---|---|---|
| #1 | 🇨🇳 China | $25.4 trillion | 18.6% | +1 |
| #2 | 🇺🇸 United States | $20.5 trillion | 15.0% | -1 |
| #3 | 🇮🇳 India | $10.5 trillion | 7.7% | +4 |
| #4 | 🇯🇵 Japan | $5.5 trillion | 4.0% | -1 |
| #5 | 🇩🇪 Germany | $4.5 trillion | 3.3% | -1 |
| #6 | 🇷🇺 Russia | $4.0 trillion | 2.9% | +5 |
| #7 | 🇮🇩 Indonesia | $3.5 trillion | 2.6% | +9 |
| #8 | 🇧🇷 Brazil | $3.4 trillion | 2.5% | +1 |
| #9 | 🇬🇧 United Kingdom | $3.1 trillion | 2.3% | -4 |
| #10 | 🇫🇷 France | $3.1 trillion | 2.3% | -4 |
| #11 | 🇮🇹 Italy | $2.5 trillion | 1.9% | -3 |
| #12 | 🇲🇽 Mexico | $2.5 trillion | 1.9% | +3 |
| #13 | 🇹🇷 Turkey | $2.4 trillion | 1.7% | +6 |
| #14 | 🇰🇷 Korea, Rep. | $2.1 trillion | 1.5% | -2 |
| #15 | 🇪🇸 Spain | $1.9 trillion | 1.4% | -1 |
Using GDP (PPP), the world economy is worth $136.5 trillion in current international U.S. dollars.
What changed the most from the nominal ranking?
With PPP, you can see Indonesia ($3.5 trillion) jumps up the ranking by nine spots to become the #7 ranked economy. Likewise, Turkey ($2.4 trillion) and India ($10.5 trillion) both climb the ranking by six and four spots respectively. China also switches with the U.S., to become the world’s largest economy.
On the flipside, it is often the more developed economies with strong currencies that see a drop in their rankings. After adjusting for PPP, the United States, Japan, Germany, France, Italy, South Korea, Spain, and the U.K. all slip from their previous positions.
For more on GDP (PPP), see the projections for the world’s largest 10 economies in 2030 that we published earlier this year.


Markets
The European Stock Market: Attractive Valuations Offer Opportunities
On average, the European stock market has valuations that are nearly 50% lower than U.S. valuations. But how can you access the market?


European Stock Market: Attractive Valuations Offer Opportunities
Europe is known for some established brands, from L’Oréal to Louis Vuitton. However, the European stock market offers additional opportunities that may be lesser known.
The above infographic, sponsored by STOXX, outlines why investors may want to consider European stocks.
Attractive Valuations
Compared to most North American and Asian markets, European stocks offer lower or comparable valuations.
| Index | Price-to-Earnings Ratio | Price-to-Book Ratio |
|---|---|---|
| EURO STOXX 50 | 14.9 | 2.2 |
| STOXX Europe 600 | 14.4 | 2 |
| U.S. | 25.9 | 4.7 |
| Canada | 16.1 | 1.8 |
| Japan | 15.4 | 1.6 |
| Asia Pacific ex. China | 17.1 | 1.8 |
Data as of February 29, 2024. See graphic for full index names. Ratios based on trailing 12 month financials. The price to earnings ratio excludes companies with negative earnings.
On average, European valuations are nearly 50% lower than U.S. valuations, potentially offering an affordable entry point for investors.
Research also shows that lower price ratios have historically led to higher long-term returns.
Market Movements Not Closely Connected
Over the last decade, the European stock market had low-to-moderate correlation with North American and Asian equities.
The below chart shows correlations from February 2014 to February 2024. A value closer to zero indicates low correlation, while a value of one would indicate that two regions are moving in perfect unison.
| EURO STOXX 50 | STOXX EUROPE 600 | U.S. | Canada | Japan | Asia Pacific ex. China |
|
|---|---|---|---|---|---|---|
| EURO STOXX 50 | 1.00 | 0.97 | 0.55 | 0.67 | 0.24 | 0.43 |
| STOXX EUROPE 600 | 1.00 | 0.56 | 0.71 | 0.28 | 0.48 | |
| U.S. | 1.00 | 0.73 | 0.12 | 0.25 | ||
| Canada | 1.00 | 0.22 | 0.40 | |||
| Japan | 1.00 | 0.88 | ||||
| Asia Pacific ex. China | 1.00 |
Data is based on daily USD returns.
European equities had relatively independent market movements from North American and Asian markets. One contributing factor could be the differing sector weights in each market. For instance, technology makes up a quarter of the U.S. market, but health care and industrials dominate the broader European market.
Ultimately, European equities can enhance portfolio diversification and have the potential to mitigate risk for investors.
Tracking the Market
For investors interested in European equities, STOXX offers a variety of flagship indices:
| Index | Description | Market Cap |
|---|---|---|
| STOXX Europe 600 | Pan-regional, broad market | €10.5T |
| STOXX Developed Europe | Pan-regional, broad-market | €9.9T |
| STOXX Europe 600 ESG-X | Pan-regional, broad market, sustainability focus | €9.7T |
| STOXX Europe 50 | Pan-regional, blue-chip | €5.1T |
| EURO STOXX 50 | Eurozone, blue-chip | €3.5T |
Data is as of February 29, 2024. Market cap is free float, which represents the shares that are readily available for public trading on stock exchanges.
The EURO STOXX 50 tracks the Eurozone’s biggest and most traded companies. It also underlies one of the world’s largest ranges of ETFs and mutual funds. As of November 2023, there were €27.3 billion in ETFs and €23.5B in mutual fund assets under management tracking the index.
“For the past 25 years, the EURO STOXX 50 has served as an accurate, reliable and tradable representation of the Eurozone equity market.”
— Axel Lomholt, General Manager at STOXX
Partnering with STOXX to Track the European Stock Market
Are you interested in European equities? STOXX can be a valuable partner:
- Comprehensive, liquid and investable ecosystem
- European heritage, global reach
- Highly sophisticated customization capabilities
- Open architecture approach to using data
- Close partnerships with clients
- Part of ISS STOXX and Deutsche Börse Group
With a full suite of indices, STOXX can help you benchmark against the European stock market.
Learn how STOXX’s European indices offer liquid and effective market access.

-

 Economy1 day ago
Economic Growth Forecasts for G7 and BRICS Countries in 2024
The IMF has released its economic growth forecasts for 2024. How do the G7 and BRICS countries compare?
-

 Markets1 week ago
U.S. Debt Interest Payments Reach $1 Trillion
U.S. debt interest payments have surged past the $1 trillion dollar mark, amid high interest rates and an ever-expanding debt burden.
-

 United States1 week ago
Ranked: The Largest U.S. Corporations by Number of Employees
We visualized the top U.S. companies by employees, revealing the massive scale of retailers like Walmart, Target, and Home Depot.
-

 Markets2 weeks ago
The Top 10 States by Real GDP Growth in 2023
This graphic shows the states with the highest real GDP growth rate in 2023, largely propelled by the oil and gas boom.
-

 Markets2 weeks ago
Ranked: The World’s Top Flight Routes, by Revenue
In this graphic, we show the highest earning flight routes globally as air travel continued to rebound in 2023.
-

 Markets2 weeks ago
Ranked: The Most Valuable Housing Markets in America
The U.S. residential real estate market is worth a staggering $47.5 trillion. Here are the most valuable housing markets in the country.

-

 Mining1 week ago
Gold vs. S&P 500: Which Has Grown More Over Five Years?
-
Markets2 weeks ago
Ranked: The Most Valuable Housing Markets in America
-

 Money2 weeks ago
Which States Have the Highest Minimum Wage in America?
-

 AI2 weeks ago
Ranked: Semiconductor Companies by Industry Revenue Share
-
Markets2 weeks ago
Ranked: The World’s Top Flight Routes, by Revenue
-

 Demographics2 weeks ago
Population Projections: The World’s 6 Largest Countries in 2075
-
Markets2 weeks ago
The Top 10 States by Real GDP Growth in 2023
-

 Demographics2 weeks ago
The Smallest Gender Wage Gaps in OECD Countries