Politics
Visualizing 200 Years of Systems of Government
Visualizing 200 Years of Systems of Government
Centuries ago, most of our ancestors were living under a different political paradigm.
Although democracy was starting to show signs of growth in some parts of the world, it was more of an idea, rather than an established or accepted system of government.
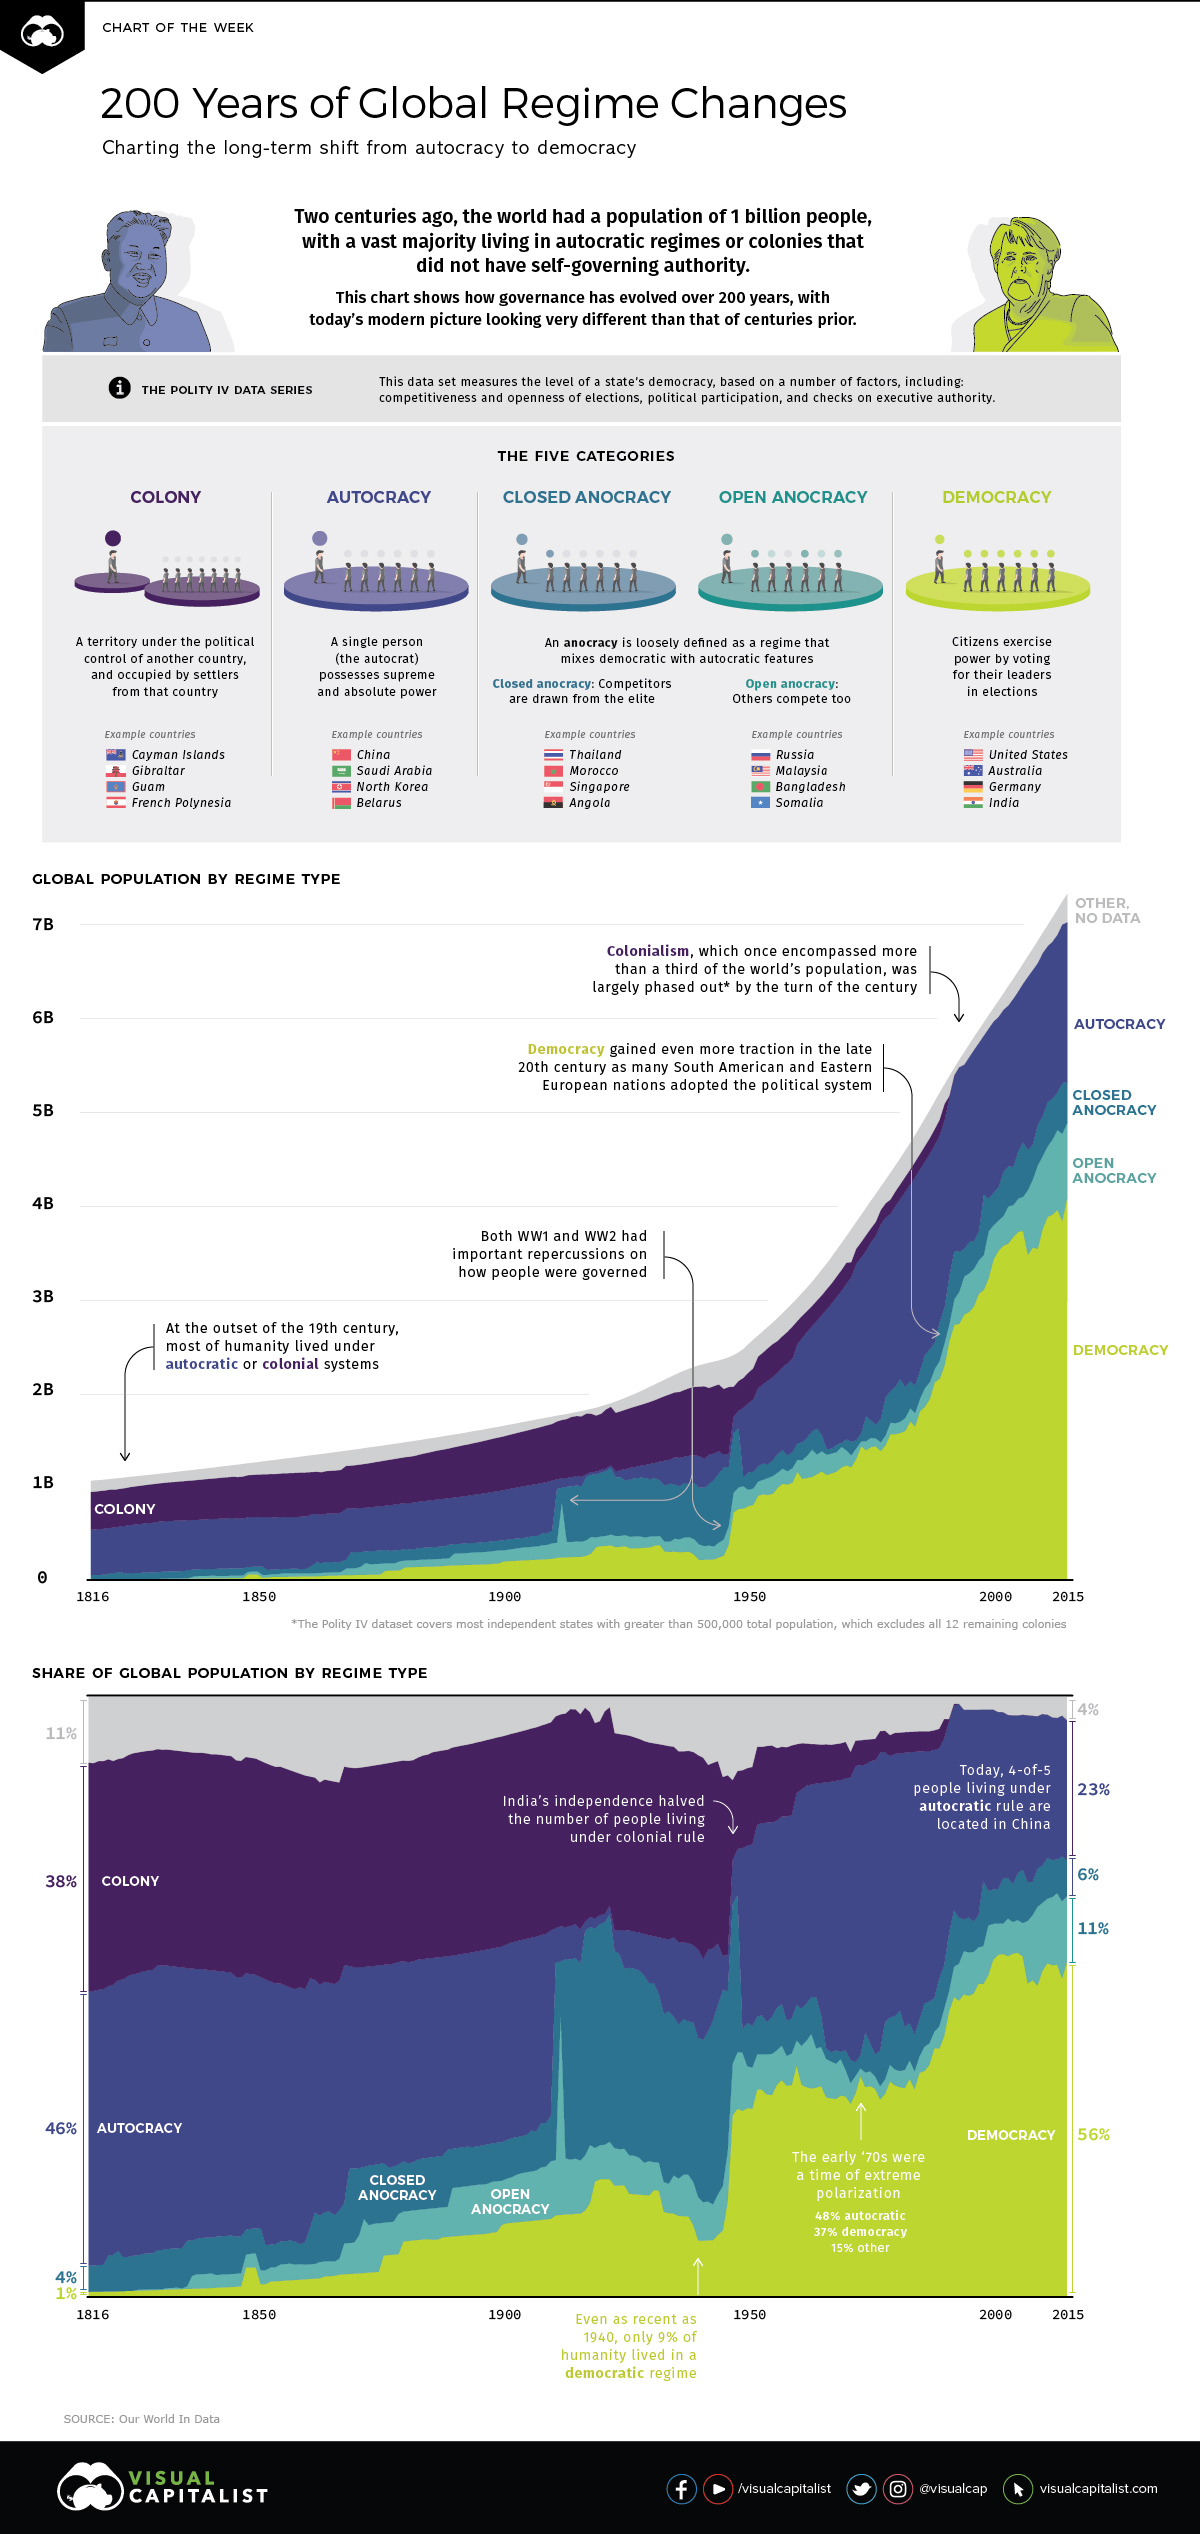
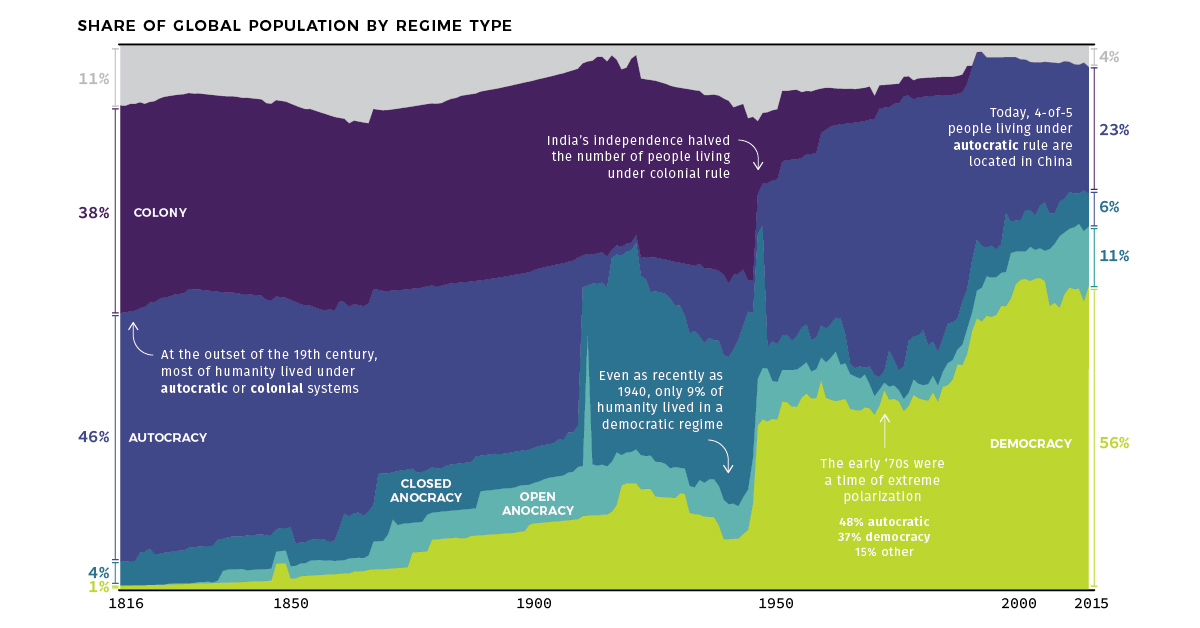
Even at the start of the 19th century, for example, it’s estimated that the vast majority of the global population — roughly 84% of all people — still lived under in autocratic regimes or colonies that lacked the authority to self-govern their own affairs.
The Evolution of Rule
Today’s set of charts look at global governance, and how it’s evolved over the last two centuries of human history.
Leveraging data from the widely-used Polity IV data set on political regimes, as well as the work done by economist Max Roser through Our World in Data, we’ve plotted an empirical view of how people are governed.
Specifically, our charts break down the global population by how they are governed (in absolute terms), as well as by the relative share of population living under those same systems of government (percentage terms).
Classifying Systems of Government
The Polity IV data series defines a state’s level of democracy by ranking it on several metrics, such as competitive and open elections, political participation, and checks on authority.
Polity scores are on a -10 to +10 scale, where the lower end (-10 to -6) corresponds with autocracies and the upper end (+6 to +10) corresponds to democracies. Below are five types of government that can be derived from the scale, and that are shown in the visualization.
- Colony
A territory under the political control of another country, and/or occupied by settlers from that country.
Examples: 🇬🇮 Gibraltar, 🇬🇺 Guam, 🇵🇫 French Polynesia - Autocracy
A single person (the autocrat) possesses supreme and absolute power.
Examples: 🇨🇳 China, 🇸🇦 Saudi Arabia, 🇰🇵 North Korea - Closed Anocracy
An anocracy is loosely defined as a regime that mixes democratic and autocratic features. In a closed anocracy, political competitors are drawn only from an elite and well-connected pool.
Examples: 🇹🇭 Thailand, 🇲🇦 Morocco, 🇸🇬 Singapore - Open Anocracy
Similar to a closed anocracy, an open anocracy draws political competitors from beyond elite groups.
Examples: 🇷🇺 Russia, 🇲🇾 Malaysia, 🇧🇩 Bangladesh - Democracy
Citizens exercise power by voting for their leaders in elections.
Examples: 🇺🇸 United States, 🇩🇪 Germany, 🇮🇳 India
A Long-Term Trend in Question
In the early 19th century, less than 1% of the global population could be found in democracies.
In more recent decades, however, the dominoes have fallen — and today, it’s estimated that 56% of the world population lives in societies that can be considered democratic, at least according to the Polity IV data series highlighted above.
While there are questions regarding a recent decline in freedom around the world, it’s worth considering that democratic governance is still a relatively new tradition within a much broader historical context.
Will the long-term trend of democracy prevail, or are the more recent indications of populism a sign of reversion?


United States
Charted: What Southeast Asia Thinks About China & the U.S.
A significant share of respondents from an ASEAN-focused survey are not happy about rising American and Chinese influence in the region.
What Southeast Asia Thinks About China & the U.S.
This was originally posted on our Voronoi app. Download the app for free on iOS or Android and discover incredible data-driven charts from a variety of trusted sources.
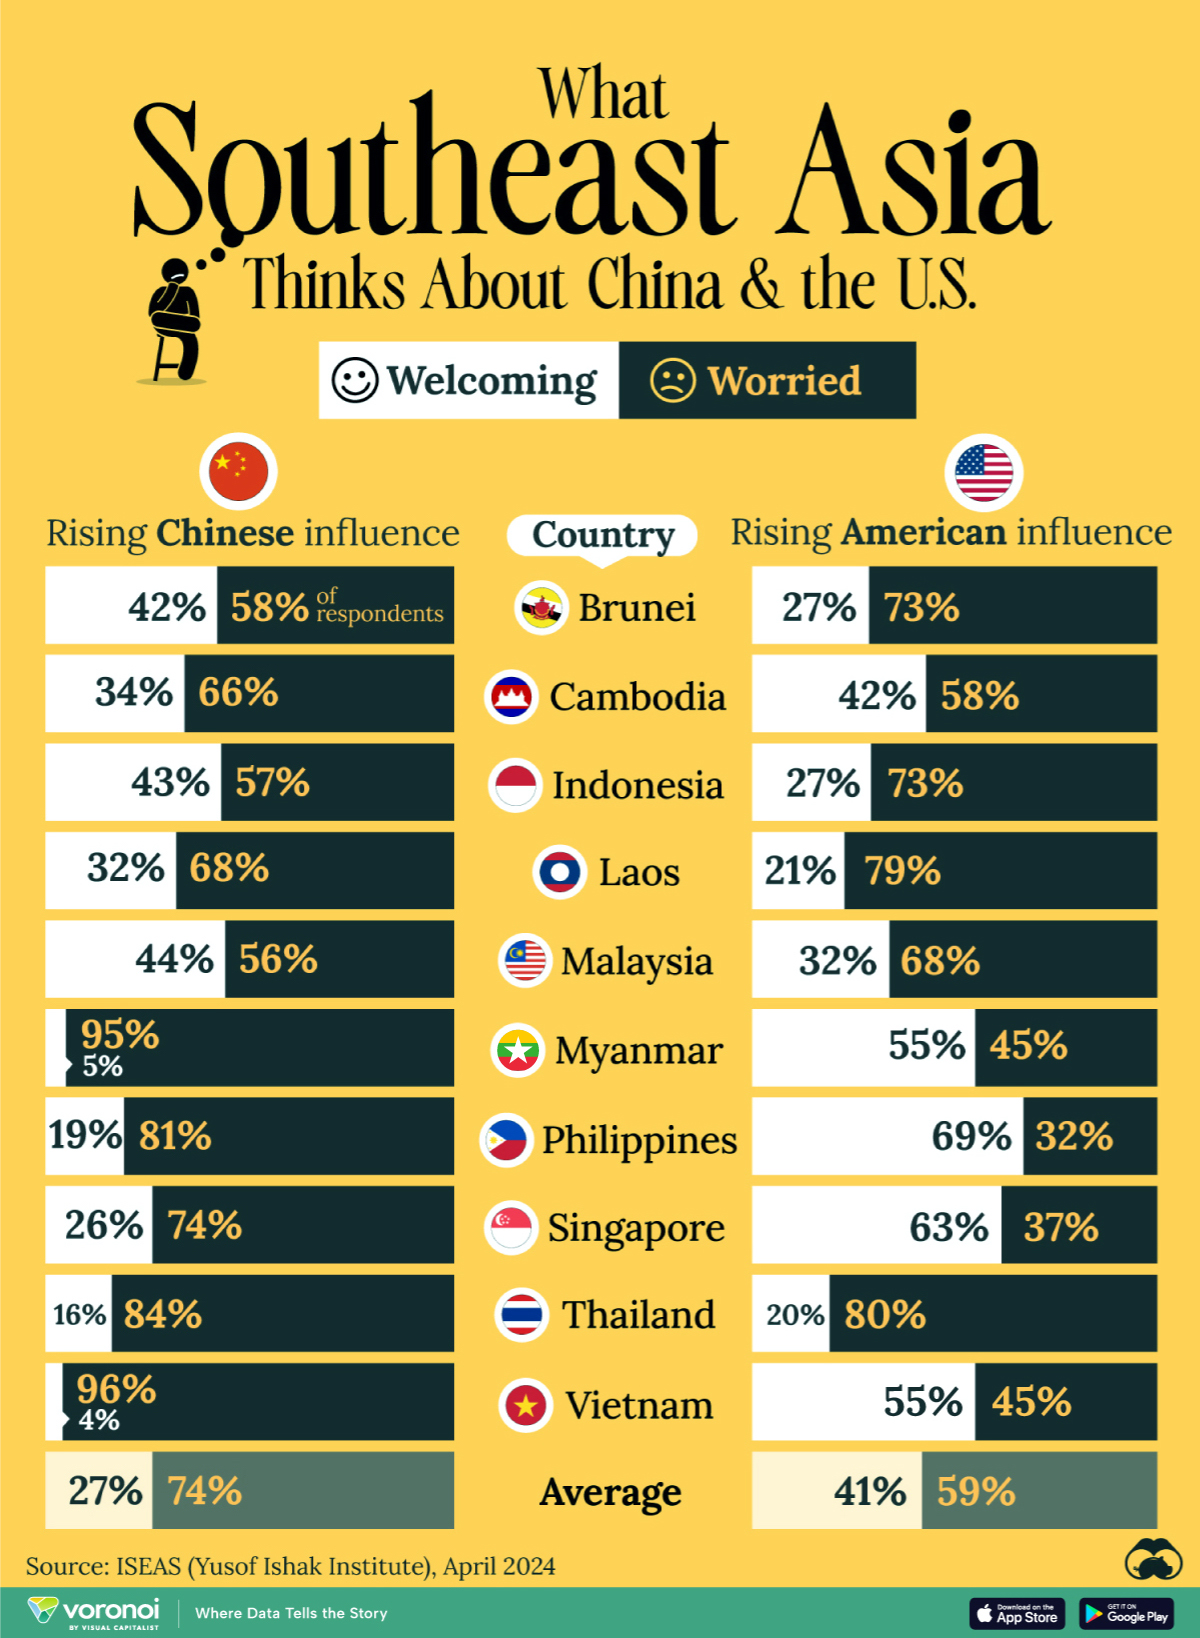
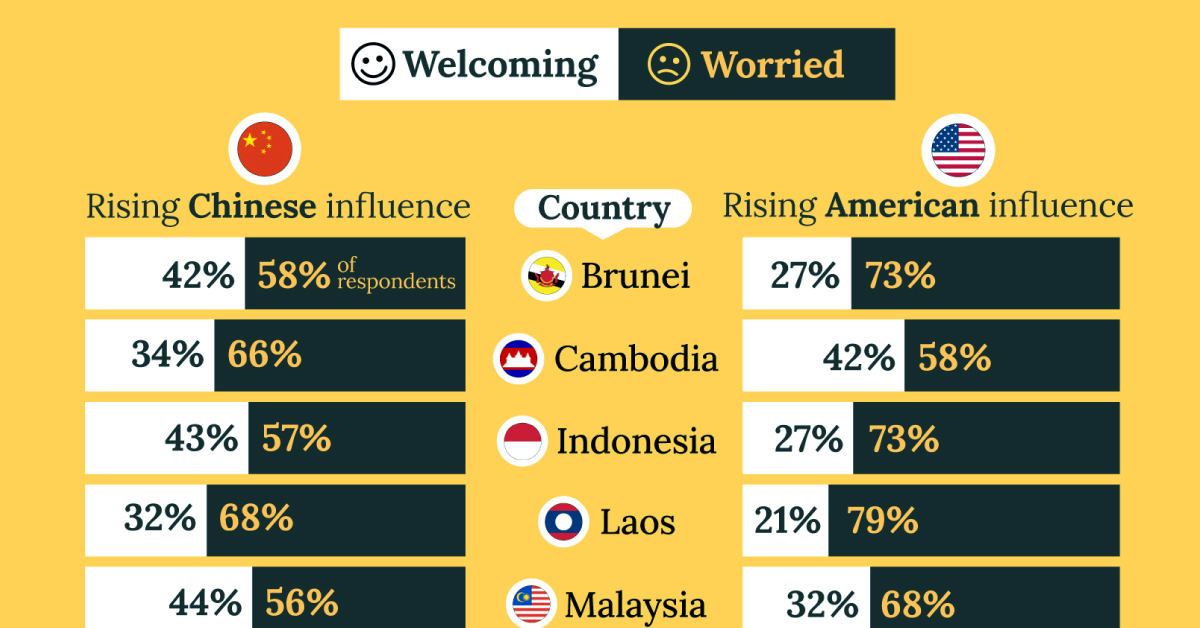
This chart visualizes the results of a 2024 survey conducted by the ASEAN Studies Centre at the ISEAS-Yusof Ishak Institute. Nearly 2,000 respondents were asked if they were worried or welcoming of rising Chinese and American geopolitical influence in their country.
The countries surveyed all belong to the Association of Southeast Asian Nations (ASEAN), a political and economic union of 10 states in Southeast Asia.
Feelings Towards China
On average, a significant share of respondents from all 10 countries are worried about rising influence from both the U.S. and China.
However, overall skepticism is higher for China, at 74% (versus 59% for U.S.).
| Country | Worried About Growing 🇨🇳 Influence | Welcome Growing 🇨🇳 Influence |
|---|---|---|
| 🇧🇳 Brunei | 58% | 42% |
| 🇰🇭 Cambodia | 66% | 34% |
| 🇮🇩 Indonesia | 57% | 43% |
| 🇱🇦 Laos | 68% | 32% |
| 🇲🇾 Malaysia | 56% | 44% |
| 🇲🇲 Myanmar | 95% | 5% |
| 🇵🇭 Philippines | 81% | 19% |
| 🇸🇬 Singapore | 74% | 26% |
| 🇹🇭 Thailand | 84% | 16% |
| 🇻🇳 Vietnam | 96% | 4% |
| Average | 74% | 27% |
The recently-cooled but still active territorial concerns over the South China Sea may play a significant role in these responses, especially in countries which are also claimants over the sea.
For example, in Vietnam over 95% of respondents said they were worried about China’s growing influence.
Feelings Towards America
Conversely, rising American influence is welcomed in two countries with competing claims in the South China Sea, the Philippines (69%) and Vietnam (55%).
| Country | Worried About Growing 🇺🇸 Influence | Welcome Growing 🇺🇸 Influence |
|---|---|---|
| 🇧🇳 Brunei | 73% | 27% |
| 🇰🇭 Cambodia | 58% | 42% |
| 🇮🇩 Indonesia | 73% | 27% |
| 🇱🇦 Laos | 79% | 21% |
| 🇲🇾 Malaysia | 68% | 32% |
| 🇲🇲 Myanmar | 45% | 55% |
| 🇵🇭 Philippines | 32% | 69% |
| 🇸🇬 Singapore | 37% | 63% |
| 🇹🇭 Thailand | 80% | 20% |
| 🇻🇳 Vietnam | 45% | 55% |
| Average | 59% | 41% |
Despite this, on a regional average, more respondents worry about growing American influence (59%) than they welcome it (41%).
Interestingly, it seems almost every ASEAN nation has a clear preference for one superpower over the other.
The only exception is Thailand, where those surveyed were not a fan of either option, with 84% worried about China, and 80% worried about the U.S.

-

 Energy6 days ago
Mapped: The Age of Energy Projects in Interconnection Queues, by State
-

 AI2 weeks ago
Visualizing AI Patents by Country
-

 Markets2 weeks ago
Economic Growth Forecasts for G7 and BRICS Countries in 2024
-

 Wealth2 weeks ago
Charted: Which City Has the Most Billionaires in 2024?
-

 Technology2 weeks ago
All of the Grants Given by the U.S. CHIPS Act
-

 Green1 week ago
The Carbon Footprint of Major Travel Methods
-

 United States1 week ago
Visualizing the Most Common Pets in the U.S.
-

 Culture1 week ago
The World’s Top Media Franchises by All-Time Revenue