Economy
The U.S. States with the Top Tech Salaries in 2021
The U.S. States with the Top Tech Salaries in 2021
In 2020, despite the economic turmoil caused by the global pandemic, America’s tech sector experienced rapid growth. Last year, the total number of U.S. tech jobs grew by 60,000.
Because of this demand, U.S. employers are willing to pay for the right talent—on average, tech workers in the U.S. earn about 61% more than the average salary. But some tech workers make more than others, depending on where they live.
This graphic by business.org uses data from the Bureau of Labor Statistics (BLS) to highlight the average annual tech salaries in each state, compared to the average salary of other occupations. We’ll also touch on the top-paying metro areas, and what type of tech jobs offer the highest compensation across the country.
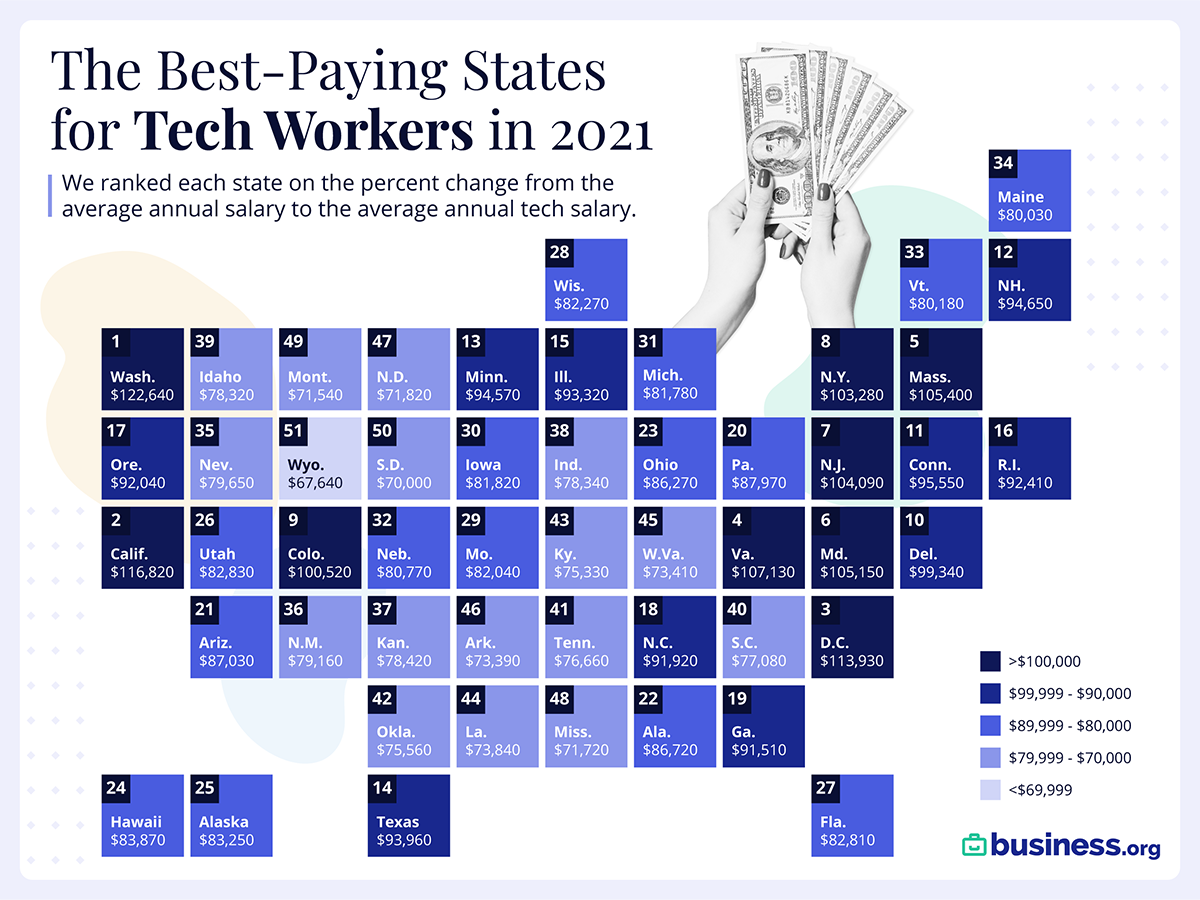
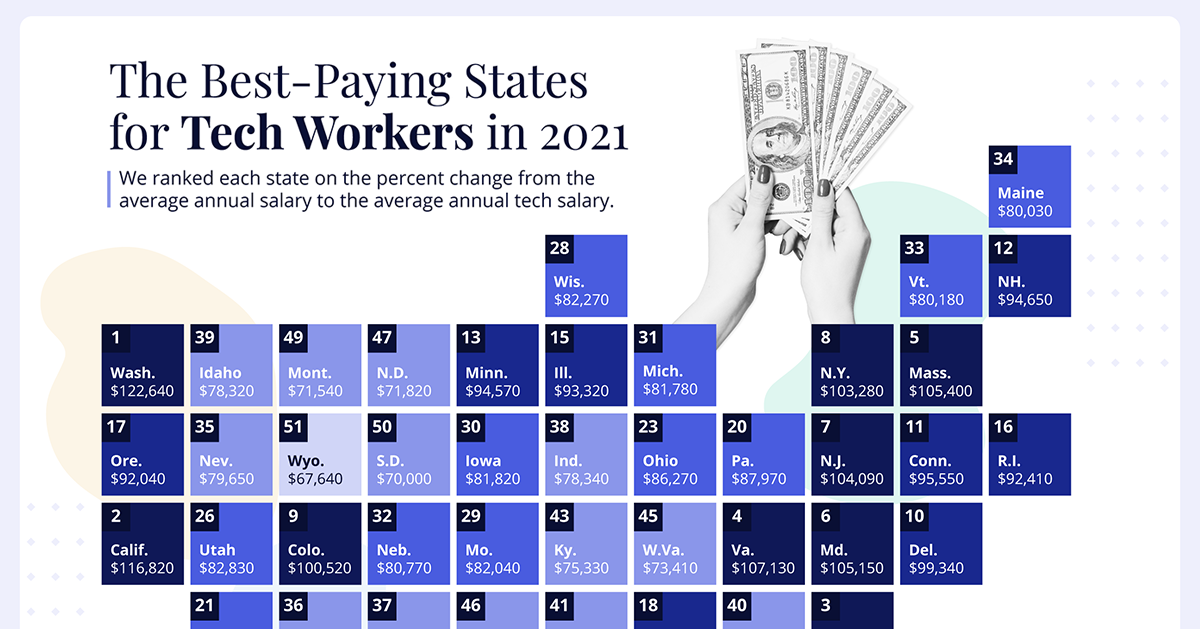
Average U.S. Tech Salaries by State
Perhaps unsurprisingly, Washington and California have the highest average salaries, largely because of the high job density in those areas.
However, when it comes to the difference in tech salary versus average salary, Alabama takes the top spot—on average, tech jobs pay 85% more than other occupations in that state.
| Rank | State | Average hourly wage for tech workers | Average salary for tech workers | % more that tech workers earn than all occupations |
|---|---|---|---|---|
| 1 | Alabama | $41.69 | $86,720 | 85% |
| 2 | Washington | $58.96 | $122,640 | 83% |
| 3 | North Carolina | $44.19 | $91,920 | 80% |
| 4 | Texas | $45.04 | $93,690 | 79% |
| 5 | Virginia | $51.50 | $107,130 | 78% |
| 6 | California | $56.16 | $116,820 | 78% |
| 7 | Georgia | $44.00 | $91,510 | 76% |
| 8 | Delaware | $47.76 | $99,340 | 75% |
| 9 | Mississippi | $34.48 | $71,720 | 72% |
| 10 | Ohio | $41.48 | $86,270 | 67% |
| 11 | Idaho | $37.65 | $78,320 | 67% |
| 12 | New Hampshire | $45.50 | $94,650 | 67% |
| 13 | South Carolina | $37.06 | $77,080 | 67% |
| 14 | Iowa | $39.34 | $81,820 | 66% |
| 15 | Florida | $39.81 | $82,810 | 66% |
| 16 | Maryland | $50.55 | $105,150 | 65% |
| 17 | Colorado | $48.33 | $100,520 | 65% |
| 18 | Arkansas | $35.28 | $73,390 | 64% |
| 19 | Kentucky | $36.21 | $75,330 | 64% |
| 20 | Missouri | $39.44 | $82,040 | 64% |
| 21 | New Jersey | $50.04 | $104,090 | 63% |
| 22 | Pennsylvania | $42.29 | $87,970 | 63% |
| 23 | Arizona | $41.84 | $87,030 | 63% |
| 24 | Oregon | $44.25 | $92,040 | 62% |
| 25 | West Virginia | $35.29 | $73,410 | 62% |
| 26 | Kansas | $37.70 | $78,420 | 61% |
| 27 | Tennessee | $36.86 | $76,660 | 61% |
| 28 | Utah | $39.82 | $82,830 | 61% |
| 29 | Minnesota | $45.47 | $94,570 | 61% |
| 30 | Indiana | $37.66 | $78,340 | 61% |
| 31 | Nebraska | $38.83 | $80,770 | 61% |
| 32 | Illinois | $44.87 | $93,320 | 61% |
| 33 | Wisconsin | $39.55 | $82,270 | 61% |
| 34 | Oklahoma | $36.33 | $75,560 | 60% |
| 35 | New Mexico | $38.06 | $79,160 | 59% |
| 36 | Louisiana | $35.50 | $73,840 | 59% |
| 37 | Nevada | $38.29 | $79,650 | 58% |
| 38 | Maine | $38.48 | $80,030 | 56% |
| 39 | South Dakota | $33.65 | $70,000 | 56% |
| 40 | Rhode Island | $44.43 | $92,410 | 53% |
| 41 | Michigan | $39.32 | $81,780 | 53% |
| 42 | New York | $49.65 | $103,280 | 52% |
| 43 | Montana | $34.40 | $71,540 | 51% |
| 44 | Massachusetts | $50.67 | $105,400 | 51% |
| 45 | Vermont | $38.55 | $80,180 | 50% |
| 46 | Connecticut | $45.94 | $95,550 | 46% |
| 47 | Hawaii | $40.32 | $83,870 | 44% |
| 48 | North Dakota | $34.53 | $71,820 | 37% |
| 49 | Alaska | $40.02 | $83,250 | 35% |
| 50 | Wyoming | $32.52 | $67,640 | 32% |
| 51 | District of Columbia | $54.78 | $113,930 | 20% |
Why are tech workers so generously compensated in Alabama? It could be because the area’s talent pool is not keeping up with demand.
In 2021, Huntsville, Alabama is expected to see 25,000 new jobs in aerospace, logistics, defense, and other tech-related industries. But these jobs could be difficult to fill given the area’s low unemployment rate.
On the other end of the spectrum, the District of Columbia has the smallest discrepancy between tech and other salaries. But at $95,330, the area has the highest average yearly salary for other occupations in the country—and tech workers still make 20% more.
Top 10 Metro Areas for Tech Salaries
Some of the highest-paying states are also home to the highest-paying metro areas.
For instance, when it comes to pay differences in tech, two of the top 10 metro areas are located in Washington state, while three are in California. The graphic below shows the metros with the highest difference between the area’s average salary and the average salary of tech jobs.
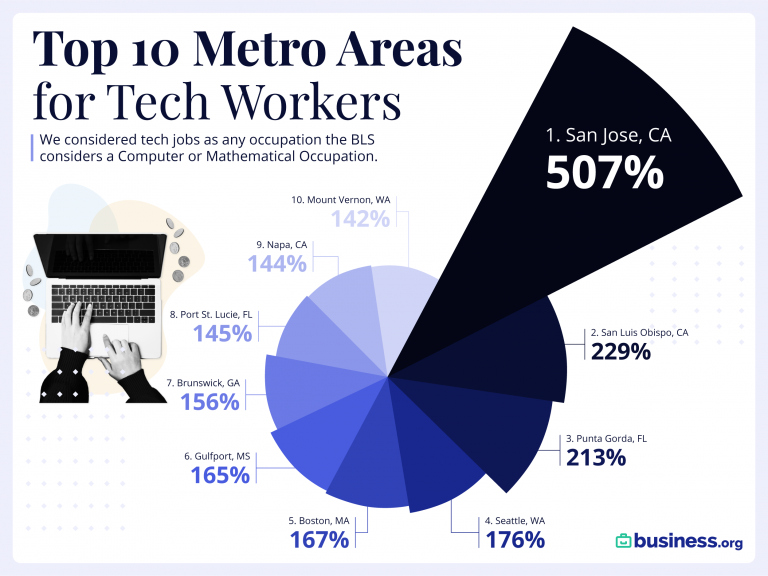
The highest pay difference between tech jobs vs the average salary is in San Jose, where tech workers make 507% more on average. This figure is almost certainly skewed because of the area’s high concentration of tech millionaires and top tier programmers.
Highest Paying Tech Jobs Nationally
Of course, location isn’t the only factor that plays into salary—the type of job is important, too. Here’s a look at U.S. tech salaries, organized by job type:
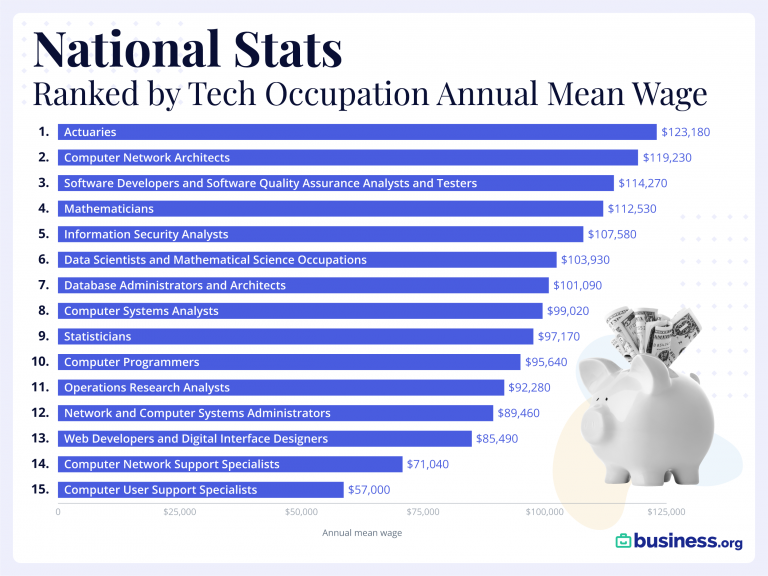
In this analysis, which looked at jobs in computer science as well as mathematics, actuaries are the highest paid professionals on average.
While actuaries are more on the mathematical and financial side of the equation, more commonly associated jobs with tech are all over the list as well: software developers, computer network architects, information security analysts, data scientists, computer programmers, web developers, computer systems analysts, and so on.
The Future of Tech is Bright
America’s information technology sector, worth about $1.6 trillion, is expected to grow to $5 trillion by the end of 2021. And as this fast-growing industry continues to boom, jobs in this sector are likely to remain in high supply.
Augmented Reality (AR) in the U.S. is looking especially promising and is projected to grow by a CAGR of 100% between 2021-2025.
In short, tech is expected to keep growing. And salaries will likely follow suit.


Economy
Economic Growth Forecasts for G7 and BRICS Countries in 2024
The IMF has released its economic growth forecasts for 2024. How do the G7 and BRICS countries compare?


G7 & BRICS Real GDP Growth Forecasts for 2024
The International Monetary Fund’s (IMF) has released its real gross domestic product (GDP) growth forecasts for 2024, and while global growth is projected to stay steady at 3.2%, various major nations are seeing declining forecasts.
This chart visualizes the 2024 real GDP growth forecasts using data from the IMF’s 2024 World Economic Outlook for G7 and BRICS member nations along with Saudi Arabia, which is still considering an invitation to join the bloc.
Get the Key Insights of the IMF’s World Economic Outlook
Want a visual breakdown of the insights from the IMF’s 2024 World Economic Outlook report?
This visual is part of a special dispatch of the key takeaways exclusively for VC+ members.
Get the full dispatch of charts by signing up to VC+.
Mixed Economic Growth Prospects for Major Nations in 2024
Economic growth projections by the IMF for major nations are mixed, with the majority of G7 and BRICS countries forecasted to have slower growth in 2024 compared to 2023.
Only three BRICS-invited or member countries, Saudi Arabia, the UAE, and South Africa, have higher projected real GDP growth rates in 2024 than last year.
| Group | Country | Real GDP Growth (2023) | Real GDP Growth (2024P) |
|---|---|---|---|
| G7 | 🇺🇸 U.S. | 2.5% | 2.7% |
| G7 | 🇨🇦 Canada | 1.1% | 1.2% |
| G7 | 🇯🇵 Japan | 1.9% | 0.9% |
| G7 | 🇫🇷 France | 0.9% | 0.7% |
| G7 | 🇮🇹 Italy | 0.9% | 0.7% |
| G7 | 🇬🇧 UK | 0.1% | 0.5% |
| G7 | 🇩🇪 Germany | -0.3% | 0.2% |
| BRICS | 🇮🇳 India | 7.8% | 6.8% |
| BRICS | 🇨🇳 China | 5.2% | 4.6% |
| BRICS | 🇦🇪 UAE | 3.4% | 3.5% |
| BRICS | 🇮🇷 Iran | 4.7% | 3.3% |
| BRICS | 🇷🇺 Russia | 3.6% | 3.2% |
| BRICS | 🇪🇬 Egypt | 3.8% | 3.0% |
| BRICS-invited | 🇸🇦 Saudi Arabia | -0.8% | 2.6% |
| BRICS | 🇧🇷 Brazil | 2.9% | 2.2% |
| BRICS | 🇿🇦 South Africa | 0.6% | 0.9% |
| BRICS | 🇪🇹 Ethiopia | 7.2% | 6.2% |
| 🌍 World | 3.2% | 3.2% |
China and India are forecasted to maintain relatively high growth rates in 2024 at 4.6% and 6.8% respectively, but compared to the previous year, China is growing 0.6 percentage points slower while India is an entire percentage point slower.
On the other hand, four G7 nations are set to grow faster than last year, which includes Germany making its comeback from its negative real GDP growth of -0.3% in 2023.
Faster Growth for BRICS than G7 Nations
Despite mostly lower growth forecasts in 2024 compared to 2023, BRICS nations still have a significantly higher average growth forecast at 3.6% compared to the G7 average of 1%.
While the G7 countries’ combined GDP is around $15 trillion greater than the BRICS nations, with continued higher growth rates and the potential to add more members, BRICS looks likely to overtake the G7 in economic size within two decades.
BRICS Expansion Stutters Before October 2024 Summit
BRICS’ recent expansion has stuttered slightly, as Argentina’s newly-elected president Javier Milei declined its invitation and Saudi Arabia clarified that the country is still considering its invitation and has not joined BRICS yet.
Even with these initial growing pains, South Africa’s Foreign Minister Naledi Pandor told reporters in February that 34 different countries have submitted applications to join the growing BRICS bloc.
Any changes to the group are likely to be announced leading up to or at the 2024 BRICS summit which takes place October 22-24 in Kazan, Russia.
Get the Full Analysis of the IMF’s Outlook on VC+
This visual is part of an exclusive special dispatch for VC+ members which breaks down the key takeaways from the IMF’s 2024 World Economic Outlook.
For the full set of charts and analysis, sign up for VC+.

-

 Mining1 week ago
Gold vs. S&P 500: Which Has Grown More Over Five Years?
-

 Markets2 weeks ago
Ranked: The Most Valuable Housing Markets in America
-

 Money2 weeks ago
Which States Have the Highest Minimum Wage in America?
-

 AI2 weeks ago
Ranked: Semiconductor Companies by Industry Revenue Share
-

 Markets2 weeks ago
Ranked: The World’s Top Flight Routes, by Revenue
-

 Countries2 weeks ago
Population Projections: The World’s 6 Largest Countries in 2075
-

 Markets2 weeks ago
The Top 10 States by Real GDP Growth in 2023
-

 Demographics2 weeks ago
The Smallest Gender Wage Gaps in OECD Countries